Above the Green Line -01
  • Market Insights
        • Commentary
          • Daily
          • Weekly
        • BUY / SELL SIGNALS
          • Trade Posts
          • Recent Trade Alerts
          • Recent Day Trades
        • BLOGROLL
          • Dividend Growth Blog
          • ETF Sector Blog
          • Dow Dogs
          • TPOW Blog
  • Strategies
        • SWING TRADING
          • Current Positions
          • Watchlists
          • Closed Positions
          • Candidates - TOP 100
          • Specialty Stocks
        • WEEKLY STOCK PICK
          • TPOW Charts
          • TPOW Performance
          • TPOW Strategy Guide
          • TPOW Performance Dashboard
        • DAY TRADING
          • Watch List
        • ATGL DASHBOARD
        • ETF STRATEGIES
          • ETF Sector Rotation
          • ETF Sector Portfolio
        • DIVIDEND GROWTH
          • Dividend Growth Portfolio
          • Dividend Calendar
        • DOGS OF THE DOW
          • Dogs of the Dow Portfolio
          • DOW 5 Portfolio
  • Markets
        • US MARKET
          • Commodities
          • Energy
          • Precious Metals
          • Volatility
        • GLOBAL MARKETS
          • Market Indices
          • Economic Calendar
          • FOREX Heat Map
          • FOREX Cross Rates
          • Crypto Currency Market
  • Investing
    • Discord Community
    • Dashboard
  • Resources
        • ARTICLES
          • Dividend Growth Model Articles
          • ETF Articles
          • Investment Strategies Articles
          • Market and Economic Insights
          • Stock Trade Articles
          • Stock Reviews
        • TOOLS
          • Stock Scanners
          • Charting Software
          • Brokerage Firms
        • STOCK CHARTS
          • Key Components
          • Reading Charts
          • Drawing Stock Charts
          • Identifying Trends
        • RETIREMENT PLANNING
  • About
    • Contact Us
    • How to Win
    • #1 At Stockcharts
    • Disclaimer
    • FAQ
  • Log In
  • Subscribe

September 19, 2021

Green Line Weekly Sep 19, 2021

FED Chart
Should be time for another Fed Printing (Jerome Powell) injection soon.

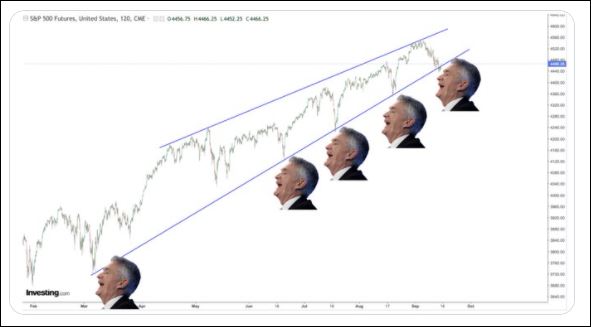
9/19/2021 Markets were lower again this week, as the Indices have now returned back down to the Green Zones and are over-sold for the Short Term. This is the first time since last November that the S&P 500 Index has Closed down in the Green Zone. So we should see an over-sold bounce soon from Green Zone Buying and FED Printing, where the Markets should be able to re-test the recent Highs. 

Most of our success recently in this Market has been using Triple Buy Signals on the Day Trading Scrolling Charts.  Most trades have happened early in the morning.

Eventually we could see higher Interest Rates and Inflation. If you continue to Follow the Green Line System, your Money should flow into the Strongest areas and your account value should be able to  grow in both Bull and Bear Markets. No predicting here, just Following the Money.

For the week the Dow was down  0.31%, the S&P 500 was down 0.59%, and the Nasdaq 100 was down 0.73 %. The Long Term Trend for the Indices is up.  

The Inflation Index (CRB) was up 0.76% for the week (a New High) and is Above the Green Line, indicating Economic Expansion.

Bonds were up 0.52% for the week, and are Above the Green Line, indicating Economic Contraction.

The US DOLLAR was up 0.62% for the week and is Above the Green Line. 

Crude Oil was up 3.10% for the week at $71.82 and GOLD was down 2.27%  at $1751.40.

SEE SUPPLEMENTAL CHARTS

_____________________________________________________________________________________________

MONEY WAVE BUYS SOON

We are currently in only 3 logged Current Positions, for the Short & Medium Term.  There are 7 investments on the Short Term Watch List. 

Be patient and WAIT for Green Zone Buy Signals!

______________________________________________________________________________________________

LONG TERM INVESTMENTS  (Some Leaders have pulled back , but Markets are near Highs.)

Long Term Scrolling Charts (Real Time)

EYES      SECOND SIGHT MEDICAL      Buy if it Closes above the Green Line (250-day avg.) with High Volume.

F      FORD MOTOR CO.      Closed above the Red Line (50-day avg.) this week, but only average Volume.     

KOPN      KOPIN CORP.      Buy if it Closes above the Red Line (50-day avg.) with High Volume.     

MGI      MONEYGRAM INT’L.    Buy if it Closes above the Red Line (50-day avg.) with High Volume.   

PRTY      PARTY CITY INC.      Buy if it Closes above the Red Line (50-day avg.) with High Volume.   

VALE      VALE  STEEL SA      Buy if it Closes above the Red Line (50-day avg.) with High Volume.   

______________________________________________________________________________________

My Trading Dashboard
Swing Trading Scrolling Charts
Day Trading Scrolling Charts

Click for  Watch Lists
Click for  Current Positions
Click for  Closed Positions

Updated Top 100 List Sep 1, 2021
Dividend Growth Portfolio  
ETF Sector Rotation System      
Dogs of the DOW System
Long Term Strategy for IRAs & 401k Plans
CNN Fear & Greed Index
Scrolling Stage Chart Investing Charts

Alert! Market Risk is MEDIUM (Yellow Zone). The probability of successful Short Term Trades is better, when the % of stocks above the 50-day avg. is below 20. 

Tell your Friends about the Green Line, and Help Animals.

______________________________________________________________________________________     

QUESTION: Steve V. writes “Do you do both long and short positions or does someone just invert the rules in a down market?”

ANSWER:  Yes, invert the Rules to Sell Short (Below G L, Below 10 R S, Dropping below 80 on Money Wave).

We will wait until the Market is in a Bear (below the Green Line), and not Short the next Correction back down to G L.

Once the Market is BEAR, we will mainly do Inverse Funds, as most investors don’t understand Shorting…

The Leaders should have nice pops up if they hold above the G L after the next Correction, and we don’t like to Sail into the Wind (with FED Printing).

Good trading and tell your friends!

ATGL

Related Post

– Green Line Weekly Sep 12, 2021

Subscribe to Our Newsletter

AGL Logo

Get our eBook Now!

Candlestick - A Swing Traders Friend

We don’t spam! Read our privacy policy for more info.

You’ve been successfully subscribed to our newsletter!

Voted #1 at Stock Charts

SH Chart
Inverse S&P 500 Fund (SH) will have a Money Wave Buy today.

Help Us Help Animals

Help Us Help Animals

Recent Comments

  • Market Breadth Indicators: A Trader’s Guide to Early Trend Detection on Backtesting: Definition and How a Trading Strategy Backtest Works
  • Island Reversal Pattern: Definition and Formation Explained on Double Top Pattern: How to Identify and Trade This Reversal Signal
  • Channel Pattern Guide: What It Is and Why It Matters on A Guide to Forecasting Using Moving Averages
  • What Is a Broadening Bottom Chart Pattern? Full Guide on Bull vs. Bear Market: An Investor’s Guide to Market Phases
  • ATGL Weekly Money Flow - 2025-05-11 on ATGL Top Pick of the Week! Apr 6, 2025

Become a Green Liner!

Help me make more Money in the Stock Market.

ON ATGL

  • DashBoard
  • Weekly Commentary
  • Daily Buy / Sell Signals
  • Day Trade Setup
  • Trading Rooms

Design & Develop By Pixelvect

STRATEGIES

  • Swing Trading
  • ATGL Pick of the Week
  • Dividend Growth
  • ETF Sector Rotation
  • Dogs of the Dow

HELP

  • ATGL Trading Rules
  • FAQ
  • Account Maintenance
  • Contact US
  • Join

FOLLOW US

Instagram Linkedin Twitter Facebook

© COPYRIGHT 2024 · ABOVETHEGREENLINE.COM · ALL RIGHTS RESERVED · PRIVACY · TERMS · CONTACT · WATCHLIST · CURRENT