Above the Green Line -01
  • Market Insights
        • Commentary
          • Daily
          • Weekly
        • BUY / SELL SIGNALS
          • Trade Posts
          • Recent Trade Alerts
          • Recent Day Trades
        • BLOGROLL
          • Dividend Growth Blog
          • ETF Sector Blog
          • Dow Dogs
          • TPOW Blog
  • Strategies
        • SWING TRADING
          • Current Positions
          • Watchlists
          • Closed Positions
          • Candidates - TOP 100
          • Specialty Stocks
        • WEEKLY STOCK PICK
          • TPOW Charts
          • TPOW Performance
          • TPOW Strategy Guide
          • TPOW Performance Dashboard
        • DAY TRADING
          • Watch List
        • ATGL DASHBOARD
        • ETF STRATEGIES
          • ETF Sector Rotation
          • ETF Sector Portfolio
        • DIVIDEND GROWTH
          • Dividend Growth Portfolio
          • Dividend Calendar
        • DOGS OF THE DOW
          • Dogs of the Dow Portfolio
          • DOW 5 Portfolio
  • Markets
        • US MARKET
          • Commodities
          • Energy
          • Precious Metals
          • Volatility
        • GLOBAL MARKETS
          • Market Indices
          • Economic Calendar
          • FOREX Heat Map
          • FOREX Cross Rates
          • Crypto Currency Market
  • Investing
    • Discord Community
    • Dashboard
  • Resources
        • ARTICLES
          • Dividend Growth Model Articles
          • ETF Articles
          • Investment Strategies Articles
          • Market and Economic Insights
          • Stock Trade Articles
          • Stock Reviews
        • TOOLS
          • Stock Scanners
          • Charting Software
          • Brokerage Firms
        • STOCK CHARTS
          • Key Components
          • Reading Charts
          • Drawing Stock Charts
          • Identifying Trends
        • RETIREMENT PLANNING
  • About
    • Contact Us
    • How to Win
    • #1 At Stockcharts
    • Disclaimer
    • FAQ
  • Log In
  • Subscribe

April 22, 2021

Money Wave Alert! Apr 22, 2021

SPX 60 Chart
The S&P 500 could not get above Monday’s High, and then sold off.

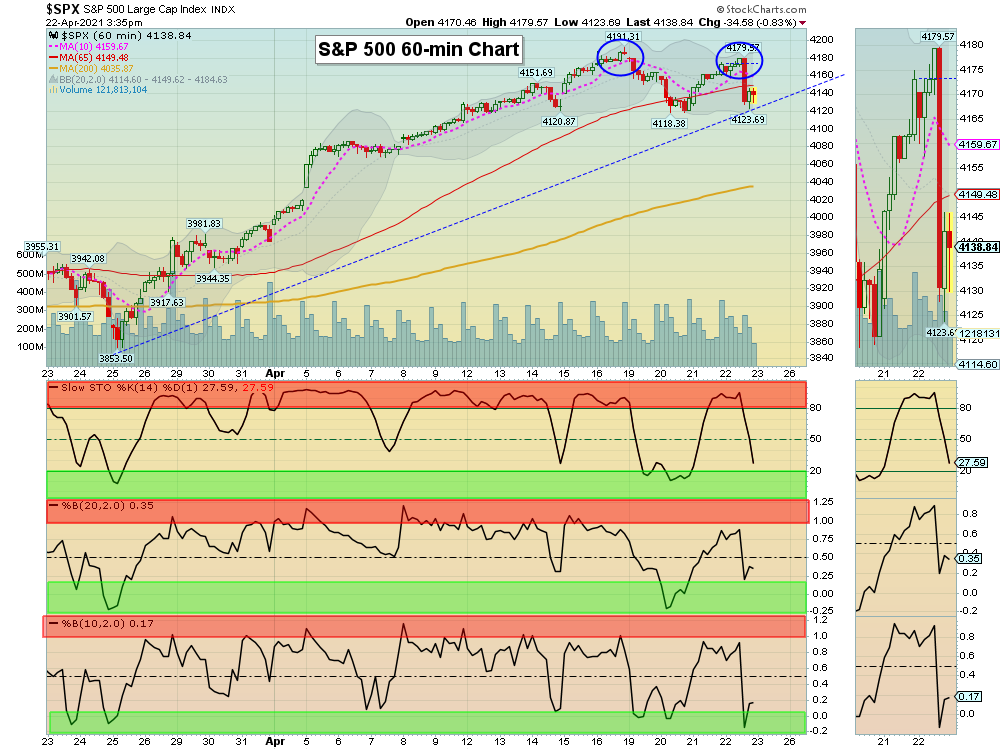
Markets were lower today as the S&P 500 and DOW 30 Indices could not get above Monday’s Highs and sold off. The Buying has been poor which probably indicates that the Markets need to come down further and become more over sold, if we want to see some stronger moves up. 

The Markets seem to be exhausted after the 80 % + move in the last year. Many have already bought, so be Cautious now. The Leaders and the S&P 500 Index are coming down from the Red Zones (probably too late to Buy for the Short Term). We had some Money Wave Buy Signals today, but the Volume was not good (lack of serious Buyers).

The better trades happen when the S&P 500 Index is also in the Green Zone. Please be patient and WAIT for pull-backs.

Several BIG pops early today, but most did not hold: DAY TRADING SETUPS.

Bonds  were up slightly down today, but are below the Green Line.

Crude Oil was up $0.27 today at $61.62.

BUYS TODAY    4/22/2021  

BNGO      BIONANO GENOMICS      Bought today above $6.17 (Pink Line) and Stopped Out below $6.60 for a 6.1% Gain (5% Trailing Stop).

DDD      3D SYSTEMS CORP.      Bought today above $21.60 (Pink Line). Target is $44. EXIT if it is going to Close below $18.19.  


AMRS      AMYRIS INC.      Money Wave Buy today but AMRS will not be bought or logged as the Volume is below average of 5.2 MIL.

KOPN      KOPIN CORP.  Money Wave Buy today but KOPN will not be bought or logged as the Volume is below average of 6.3 MIL.

VUZI      VUZIX CORP.       Money Wave Buy today but VUZI will not be bought or logged as the Volume is below average of 8.9 MIL.

We will “Not Log” trades if the Reward/Risk is not at least 2:1, or Low Volume. These have more risk.

__________________________________________________________________________________________________________

NEW! JUMP START SCROLLING CHARTS: (Buy Signal should be very soon… Click on the Jump Start link for more info.)      

PAVM      PAVMED INC.      Buy above $4.64 with High Volume with a 5% Trailing Sell Stop Loss below it.

RIOT      RIOT BLOCKCHAIN    Buy above $42.21 with High Volume with a 5% Trailing Sell Stop Loss below it.

ZKIN     ZK INT’L. GROUP        Buy above $5.80 with High Volume with a 5% Trailing Sell Stop Loss below it.

____________________________________________________________________________________________________________

WATCH LIST

WATCH LIST SCROLLING CHARTS (Real Time)       

UEC      URANIUM ENERGY CORP.    Buy above the Pink Line around $2.79 with High Volume with a 5% Trailing Sell Stop Loss below it. 

Please be patient and wait for Money Wave Buy Signals.  We will email you when they are ready. Follow on the WATCH LIST.
Emotions are very high now, so please do not Buy unless you are VERY NIMBLE.

The Leaders are Way Above the Green Lines (all Investments eventually return to their Green Lines).      

____________________________________________________________________________________________________________

SELLS TODAY   NONE TODAY        

Click for  CURRENT POSITION CHARTS – Real Time  (Please check and adjust your Sell Stops).         
Click for  CLOSED POSITIONS,   
NEW:       MY TRADING DASHBOARD

DAY TRADING SETUPS
NEW:  TRADE ALERTS
ARE YOUR INVESTMENTS ABOVE THE GREEN LINE?
ETF SECTOR ROTATION SYSTEM   
TOP 100 LIST Updated Apr 4, 2021

Many like to Buy the day before, near the Close, if the Money Wave is going to create a Buy Signal (Closing > 20 and out of the Green Zone).

Don’t Buy if the Investment has already popped up too much. Money Wave Buys are usually good for a 3-6 %  move in a few days.

We will “Not Log” trades if the Reward/Risk is not at least 2:1, or Low Volume. These have more risk.   

Related Post

– Money Wave Alert! Apr 21, 2021

Subscribe to Our Newsletter

AGL Logo

Get our eBook Now!

Candlestick - A Swing Traders Friend

We don’t spam! Read our privacy policy for more info.

You’ve been successfully subscribed to our newsletter!

Voted #1 at Stock Charts

SH Chart
Inverse S&P 500 Fund (SH) will have a Money Wave Buy today.

Help Us Help Animals

Help Us Help Animals

Recent Comments

  • Market Breadth Indicators: A Trader’s Guide to Early Trend Detection on Backtesting: Definition and How a Trading Strategy Backtest Works
  • Island Reversal Pattern: Definition and Formation Explained on Double Top Pattern: How to Identify and Trade This Reversal Signal
  • Channel Pattern Guide: What It Is and Why It Matters on A Guide to Forecasting Using Moving Averages
  • What Is a Broadening Bottom Chart Pattern? Full Guide on Bull vs. Bear Market: An Investor’s Guide to Market Phases
  • ATGL Weekly Money Flow - 2025-05-11 on ATGL Top Pick of the Week! Apr 6, 2025

Become a Green Liner!

Help me make more Money in the Stock Market.

ON ATGL

  • DashBoard
  • Weekly Commentary
  • Daily Buy / Sell Signals
  • Day Trade Setup
  • Trading Rooms

Design & Develop By Pixelvect

STRATEGIES

  • Swing Trading
  • ATGL Pick of the Week
  • Dividend Growth
  • ETF Sector Rotation
  • Dogs of the Dow

HELP

  • ATGL Trading Rules
  • FAQ
  • Account Maintenance
  • Contact US
  • Join

FOLLOW US

Instagram Linkedin Twitter Facebook

© COPYRIGHT 2024 · ABOVETHEGREENLINE.COM · ALL RIGHTS RESERVED · PRIVACY · TERMS · CONTACT · WATCHLIST · CURRENT