Above the Green Line -01
  • Market Insights
        • Commentary
          • Daily
          • Weekly
        • BUY / SELL SIGNALS
          • Trade Posts
          • Recent Trade Alerts
          • Recent Day Trades
        • BLOGROLL
          • Dividend Growth Blog
          • ETF Sector Blog
          • Dow Dogs
          • TPOW Blog
  • Strategies
        • SWING TRADING
          • Current Positions
          • Watchlists
          • Closed Positions
          • Candidates - TOP 100
          • Specialty Stocks
        • WEEKLY STOCK PICK
          • TPOW Charts
          • TPOW Performance
          • TPOW Strategy Guide
          • TPOW Performance Dashboard
        • DAY TRADING
          • Watch List
        • ATGL DASHBOARD
        • ETF STRATEGIES
          • ETF Sector Rotation
          • ETF Sector Portfolio
        • DIVIDEND GROWTH
          • Dividend Growth Portfolio
          • Dividend Calendar
        • DOGS OF THE DOW
          • Dogs of the Dow Portfolio
          • DOW 5 Portfolio
  • Markets
        • US MARKET
          • Commodities
          • Energy
          • Precious Metals
          • Volatility
        • GLOBAL MARKETS
          • Market Indices
          • Economic Calendar
          • FOREX Heat Map
          • FOREX Cross Rates
          • Crypto Currency Market
  • Investing
    • Discord Community
    • Dashboard
  • Resources
        • ARTICLES
          • Dividend Growth Model Articles
          • ETF Articles
          • Investment Strategies Articles
          • Market and Economic Insights
          • Stock Trade Articles
          • Stock Reviews
        • TOOLS
          • Stock Scanners
          • Charting Software
          • Brokerage Firms
        • STOCK CHARTS
          • Key Components
          • Reading Charts
          • Drawing Stock Charts
          • Identifying Trends
        • RETIREMENT PLANNING
  • About
    • Contact Us
    • How to Win
    • #1 At Stockcharts
    • Disclaimer
    • FAQ
  • Log In
  • Subscribe

March 29, 2021

Money Wave Alert! Mar 29, 2021

FUTU Chart
Buy Signal today on Futu Holdings LTD. (FUTU) was good for a 12 % Pop.

Markets were mixed today as the S&P 500 and DOW 30 Indices are on all time Highs, so many investors do not want to Buy up here. But nobody wants to Sell either, from FOMO (Fear Of Missing Out). Because the Markets are near Highs, we are not Buying anything that has Volume below the 50-day average of Volume. Low Volume can mean a lack of Buyers, and caution.

Try to Buy only Investments that are still above the Red Lines (50-day avgs.) as they tend to bounce first.

Some Stock Indices and Leaders popped up out of the Green Zones on Thursday and Friday to create a rally, but the Low Volume is not encouraging for further upside. Where are the Buyers? The better trades happen when the S&P 500 Index is also in the Green Zone. 

Low Volume and nothing popping on DAY TRADING SETUPS

Bonds  were down today, and are below the Green Line.

Crude Oil was up $0 61 today at $61 41

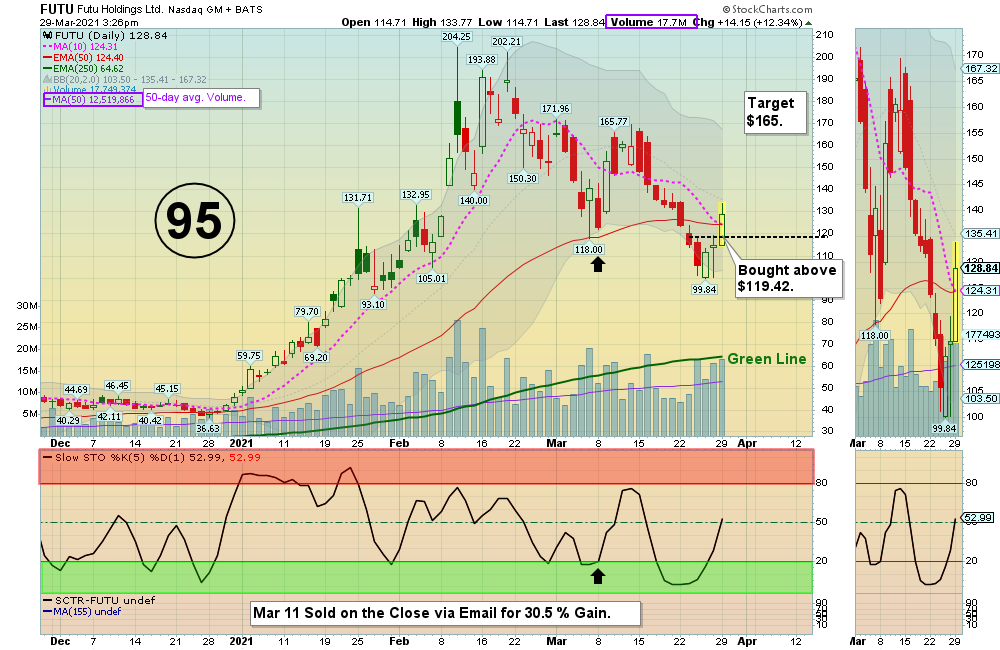
BUYS TODAY    3/29/2021       

FUTU      FUTU HOLDINGS ADR      Bought above the $119.42 today. Target is $165.00.  Don’t Take a Loss!

JUMP START: (Buy Signal should be very soon… Click on the Jump Start link for more info.)   

CAN      CANAAN INC. ADR

CLR      CONTINENTAL RESOURCES        Buy above $26.75 with High Volume with a 5% Trailing Sell Stop Loss below it.   

DDD      3D SYSTEMS CORP.      Buy above $27.90 with High Volume with a 5% Trailing Sell Stop Loss below it.  2nd Money Wave Buy soon.      

RIG      TRANSOCEAN INC.      Buy above $3.58 with High Volume with a 5% Trailing Sell Stop Loss below it.

____________________________________________________________________________________________________________

WATCH LIST

WATCH LIST SCROLLING CHARTS (Real Time)     

NIO       NIO INC.      2nd Money Wave Buy soon with High Volume .     

Please be patient and wait for Money Wave Buy Signals.  We will email you when they are ready. Follow on the WATCH LIST.
Emotions are very high now, so please do not Buy unless you are VERY NIMBLE.

The Leaders are Way Above the Green Lines (all Investments eventually return to their Green Lines).

____________________________________________________________________________________________________________

SELLS TODAY   

Z      ZILLOW GROUP      LOWER the Sell Stop Loss below the Green Line  of $106.23 until it bottoms. This trade was not logged.      

Please update your Sell Stops.    

Click for  CURRENT POSITION CHARTS – Real Time  (Please check and adjust your Sell Stops).         
Click for  CLOSED POSITIONS,   
NEW:       MY TRADING DASHBOARD

DAY TRADING SETUPS
NEW:  TRADE ALERTS
ARE YOUR INVESTMENTS ABOVE THE GREEN LINE?
ETF SECTOR ROTATION SYSTEM   
TOP 100 LIST Updated Mar 1, 2021

Many like to Buy the day before, near the Close, if the Money Wave is going to create a Buy Signal (Closing > 20 and out of the Green Zone).

Don’t Buy if the Investment has already popped up too much. Money Wave Buys are usually good for a 3-6 %  move in a few days.

We will “Not Log” trades if the Reward/Risk is not at least 2:1.  These have more risk.   

Related Post

– Money Wave Alert! Mar 26, 2021

Subscribe to Our Newsletter

AGL Logo

Get our eBook Now!

Candlestick - A Swing Traders Friend

We don’t spam! Read our privacy policy for more info.

You’ve been successfully subscribed to our newsletter!

Voted #1 at Stock Charts

SH Chart
Inverse S&P 500 Fund (SH) will have a Money Wave Buy today.

Help Us Help Animals

Help Us Help Animals

Recent Comments

  • Breakout Trading Strategies That Can Boost Your Gains on 7 Day Trading Strategies for New Investors
  • What the Descending Staircase Pattern Tells You About the Market on Bull vs. Bear Market: An Investor’s Guide to Market Phases
  • Want to Protect Your Capital? Start With Better Position Sizing on Risk Management in Trading: Tools and Techniques
  • Want to Protect Your Capital? Start With Better Position Sizing on Swing Trading Risk Management: Tips To Safeguard Your Profits
  • Price Action Trading Strategies That Work in Any Market on What Is a Death Cross in Stocks? A Bearish Market Signal

Become a Green Liner!

Help me make more Money in the Stock Market.

ON ATGL

  • DashBoard
  • Weekly Commentary
  • Daily Buy / Sell Signals
  • Day Trade Setup
  • Trading Rooms

Design & Develop By Pixelvect

STRATEGIES

  • Swing Trading
  • ATGL Pick of the Week
  • Dividend Growth
  • ETF Sector Rotation
  • Dogs of the Dow

HELP

  • ATGL Trading Rules
  • FAQ
  • Account Maintenance
  • Contact US
  • Join

FOLLOW US

Instagram Linkedin Twitter Facebook

© COPYRIGHT 2024 · ABOVETHEGREENLINE.COM · ALL RIGHTS RESERVED · PRIVACY · TERMS · CONTACT · WATCHLIST · CURRENT