Above the Green Line -01
  • Market Insights
        • Commentary
          • Daily
          • Weekly
        • BUY / SELL SIGNALS
          • Trade Posts
          • Recent Trade Alerts
          • Recent Day Trades
        • BLOGROLL
          • Dividend Growth Blog
          • ETF Sector Blog
          • Dow Dogs
          • TPOW Blog
  • Strategies
        • SWING TRADING
          • Current Positions
          • Watchlists
          • Closed Positions
          • Candidates - TOP 100
          • Specialty Stocks
        • WEEKLY STOCK PICK
          • TPOW Charts
          • TPOW Performance
          • TPOW Strategy Guide
          • TPOW Performance Dashboard
        • DAY TRADING
          • Watch List
        • ATGL DASHBOARD
        • ETF STRATEGIES
          • ETF Sector Rotation
          • ETF Sector Portfolio
        • DIVIDEND GROWTH
          • Dividend Growth Portfolio
          • Dividend Calendar
        • DOGS OF THE DOW
          • Dogs of the Dow Portfolio
          • DOW 5 Portfolio
  • Markets
        • US MARKET
          • Commodities
          • Energy
          • Precious Metals
          • Volatility
        • GLOBAL MARKETS
          • Market Indices
          • Economic Calendar
          • FOREX Heat Map
          • FOREX Cross Rates
          • Crypto Currency Market
  • Investing
    • Discord Community
    • Dashboard
  • Resources
        • ARTICLES
          • Dividend Growth Model Articles
          • ETF Articles
          • Investment Strategies Articles
          • Market and Economic Insights
          • Stock Trade Articles
          • Stock Reviews
        • TOOLS
          • Stock Scanners
          • Charting Software
          • Brokerage Firms
        • STOCK CHARTS
          • Key Components
          • Reading Charts
          • Drawing Stock Charts
          • Identifying Trends
        • RETIREMENT PLANNING
  • About
    • Contact Us
    • How to Win
    • #1 At Stockcharts
    • Disclaimer
    • FAQ
  • Log In
  • Subscribe

September 8, 2019

Green Line Weekly Sep 8, 2019

SPY Weekly Chart
The S&P 500 Index is going back up to re-test the July Highs on lower Volume.


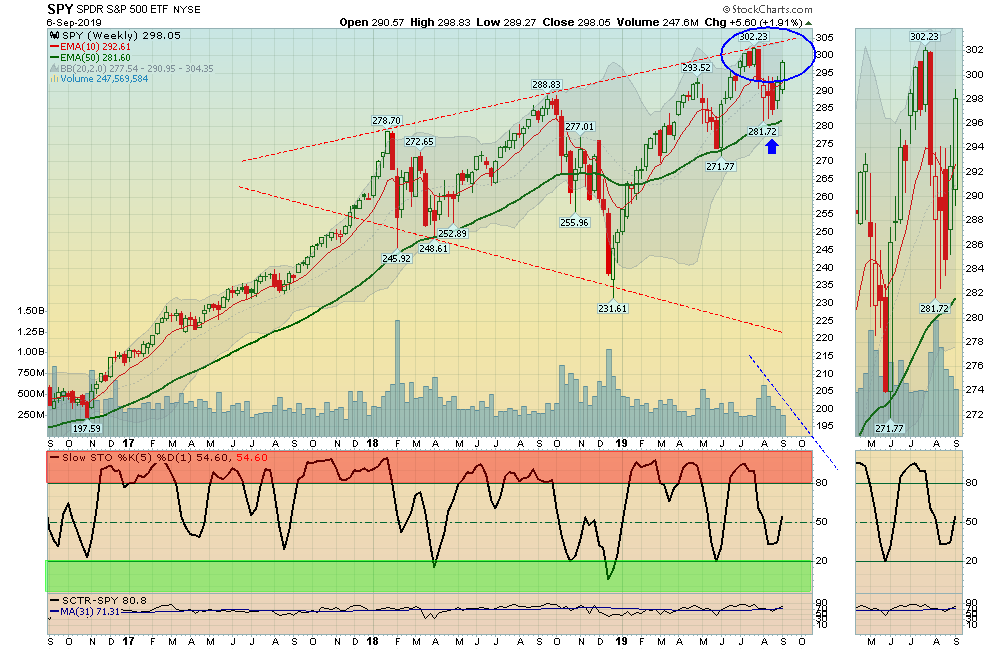
09/08/2019:  Markets were up again for the week, after Good News about a meeting to resolve the Trade War. The S&P 500 Index was able to Close above 2944, so next Resistance is the July High of 3028.  The Small Caps and Transports are still weak.

The 2 FEAR Trades (Bonds and Gold) were both down for the week, as the FEAR is diminishing. Bonds and Gold still have High Momentum and could re-test the Highs again after correcting down a little more. (See Watch List ). So probably no Trade Deal right away.

For the week the Dow was up 1.59%, the S&P 500 was up 1.79%, and the Nasdaq 100 was up 2.20%.  The Long Term Trend on the Stock Markets is UP. 


The Inflation Index (CRB) was up 1.33% and is Below the Green Line, indicating Economic Weakness.

Bonds  were down 0.84% for the week and are Way Above the Green Line, indicating Economic Weakness.

The US DOLLAR was down 0.33%, after making another 3 year High. 

Crude Oil was up 2.58% for the week at $56.52, and GOLD was down 0.91%  at $1515.50.

___________________________________________________________________________________________

MONEY WAVE BUYS SOON:   

We are currently in 4 logged Open Positions, for the Short & Medium Term.  There are 4 Investments on the Short Term Watch List. 

Be patient and WAIT for Green Zone Buy Signals!

______________________________________________________________________________________________

LONG TERM INVESTMENTS 

Buy the Leading Investments that are down near the weekly Green Zones.  

KTOS     KRATOS DEFENSE    Wait for next Daily Green Zone Buy.

PYPL     PAYPAL HOLDINGS      Wait for next Daily Green Zone Buy.

SBGI     SINCLAIR BROADCAST GROUP  Buy if it is going to Close above $47.55.   

XRX     XEROX CORP.     Buy when it Closes back Above the Green Line.

ZEN     ZENDESK INC.    Wait for next Daily Green Zone Buy.  

ZNGA     ZYNGA INC.    Buy when it Closes back Above the Red Line.  

ZS     ZSCALER INC.  Buy when it Closes back Above the Pink Line.  

___________________________________________________________________________________________

Click for  Portfolio (Open Positions)  
Click for  Watch List
Click for  Closed Positions


Alert! Market Risk is MEDIUM (Yell0w Zone). The probability of successful Short Term Trades is better, when the % of stocks above the 50-day avg. is below 20. 

Tell your Friends about the Green Line, and Help Animals

___________________________________________________________________________________________

QUESTION:  James M. writes: 

1. I received a Money Wave Buy text today on BRFS at the usual time.  Was that for a short, medium, or long term hold? It doesn’t specify.

2. I understand the target and exit stops, but when do I buy? At the moment of the text? At close?

3. When the money wave buy text’s come, do I assume your 3 golden rules have been met?

4. Finally, why is your Forum so dated?

ANSWER:

  1. All Money Wave Buys are Short Term (we will clarify that in the Rules). Medium and Long Term Buys will be stated.
  1. The Rules require that the Money Wave is going to Close > 20. So we send out the email just before the Close so you can Buy before or on the Close.

      Also read about “JUMP START”  as many pop too much by the end of the day. 

  1. Yes, the 3 Green Line Rules must apply.  (today the Relative Strength of NVTA dropped below 90, so we let you know in the email).
  1. The Forum had a problem with adding new content, but that is fixed now. Please try out the Forum!

Related Post

– Green Line Weekly Sep 1, 2019

Subscribe to Our Newsletter

AGL Logo

Get our eBook Now!

Candlestick - A Swing Traders Friend

We don’t spam! Read our privacy policy for more info.

You’ve been successfully subscribed to our newsletter!

Voted #1 at Stock Charts

SH Chart
Inverse S&P 500 Fund (SH) will have a Money Wave Buy today.

Help Us Help Animals

Help Us Help Animals

Recent Comments

  • Market Breadth Indicators: A Trader’s Guide to Early Trend Detection on Backtesting: Definition and How a Trading Strategy Backtest Works
  • Island Reversal Pattern: Definition and Formation Explained on Double Top Pattern: How to Identify and Trade This Reversal Signal
  • Channel Pattern Guide: What It Is and Why It Matters on A Guide to Forecasting Using Moving Averages
  • What Is a Broadening Bottom Chart Pattern? Full Guide on Bull vs. Bear Market: An Investor’s Guide to Market Phases
  • ATGL Weekly Money Flow - 2025-05-11 on ATGL Top Pick of the Week! Apr 6, 2025

Become a Green Liner!

Help me make more Money in the Stock Market.

ON ATGL

  • DashBoard
  • Weekly Commentary
  • Daily Buy / Sell Signals
  • Day Trade Setup
  • Trading Rooms

Design & Develop By Pixelvect

STRATEGIES

  • Swing Trading
  • ATGL Pick of the Week
  • Dividend Growth
  • ETF Sector Rotation
  • Dogs of the Dow

HELP

  • ATGL Trading Rules
  • FAQ
  • Account Maintenance
  • Contact US
  • Join

FOLLOW US

Instagram Linkedin Twitter Facebook

© COPYRIGHT 2024 · ABOVETHEGREENLINE.COM · ALL RIGHTS RESERVED · PRIVACY · TERMS · CONTACT · WATCHLIST · CURRENT