Stock Ideas and Market Analysis
The Stock ideas and Market analysis presented below are generated by 3rd Party news feeds. Its a collection of articles, reports, and insights from industry-recognized third parties such as S&P Capital IQ, Dow Jones, and Credit Suisse. These resources provide a wealth of information on a broad range of stocks, ETFs, and investment strategies. You can access a variety of helpful tools and resources, like interactive charts, to help you validate new ideas. Our goal is to offer a centralized hub for individuals seeking timely and relevant information on key topics that can potentially impact markets and trading ideas. The ideas do NOT necessarily follow the Green Line Method for investing. If interested in learning more join Above the Green Line today.
-
Next move
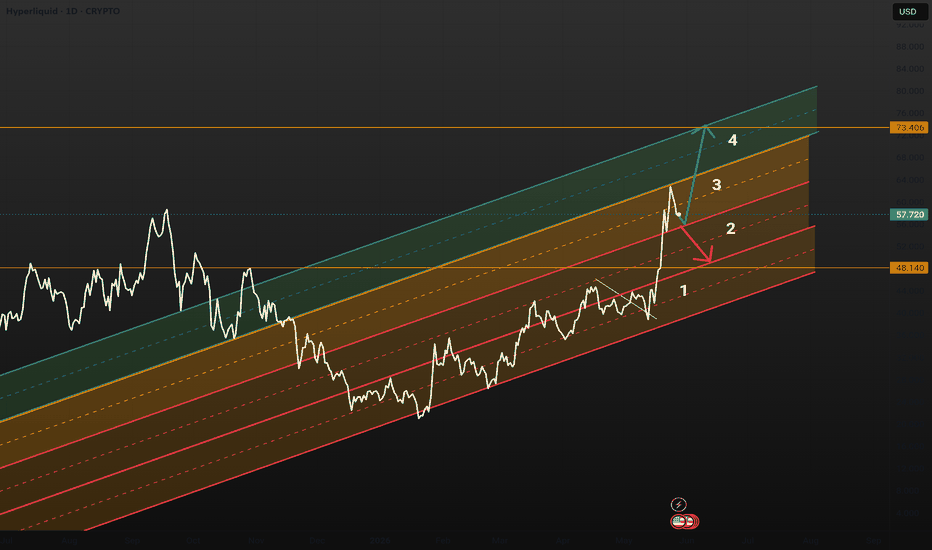 The price has been rejected at the key resistance trendline which is the upper bou dry of theorange channel, a support at the lower trwnd line of the orange channel(3) can push the price upwards to the upper boundry of the green channel( 4) a break below the channel 3 can push it downwards. Worst case support will be the lower boundry of the rec channel( marked as 1)... Read more
 -
Raffay Fx
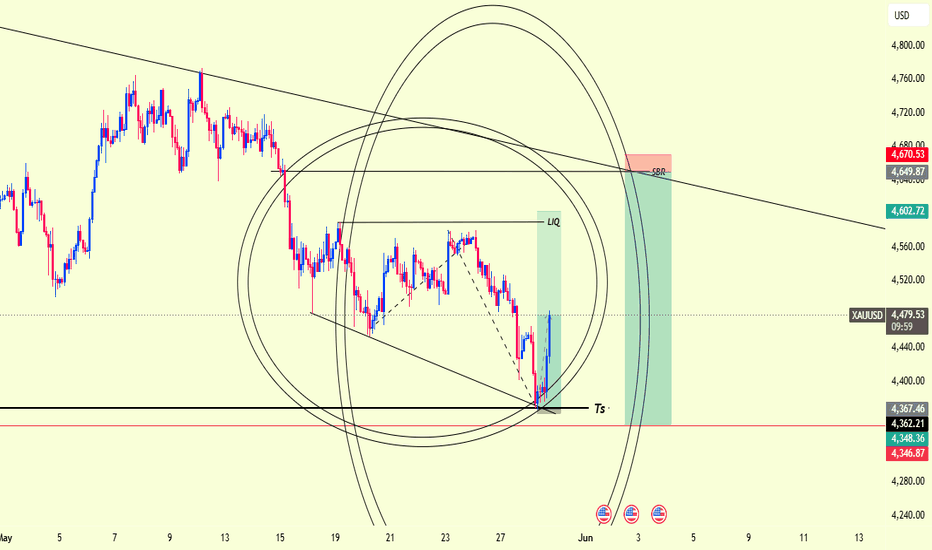 Looking for short from up side because there is 3confirmation first is obr=orderblock resistance. second is trendline.Third is circle fib confirmation And the only one thing thats why iam sure on this setup is tha all thing is connect on 1 time which is 2 june 13:00 at this date and time we got our entry so if we see market on this time at our entry point take trade without hazitating . and hold it fro full tp... Read more
 -
MAHN: long with an intermediate target in the 230s
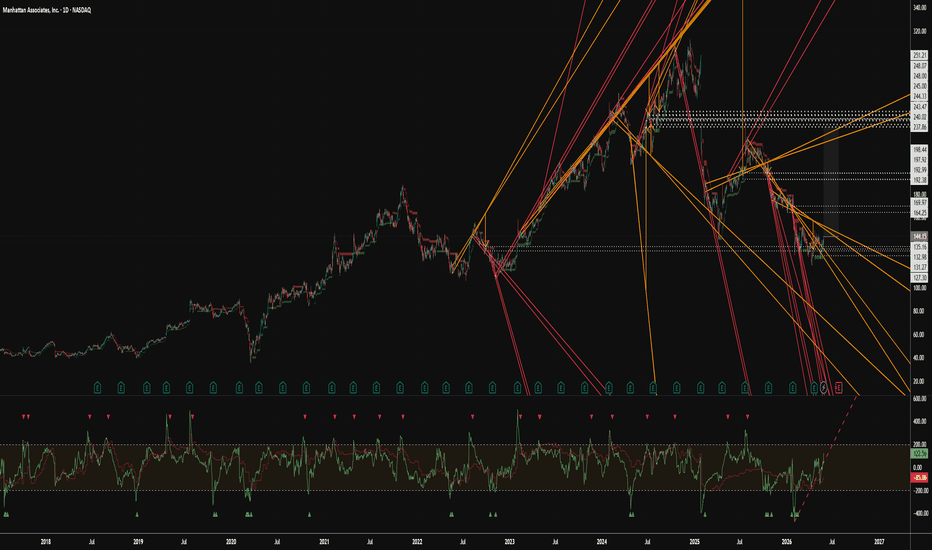 Taking on a 1/2 lot position as the risk profile is higher than my standard with a 14% downside to the stop. If it does catch bottom here I have potential to be entering at the start of a C wave. CCI system likes 230s as an intermediate target, elliott would be much, much higher.... Read more
 -
Reddit, attempt 2
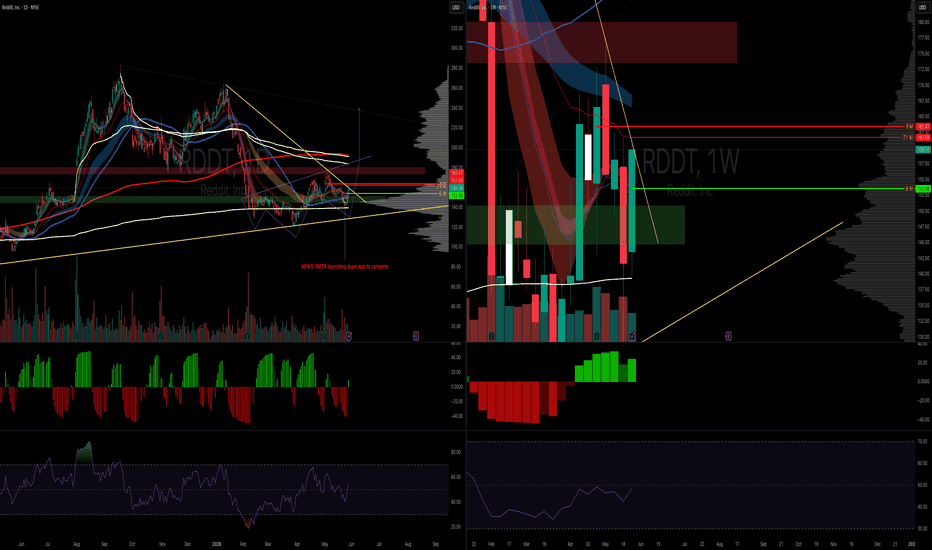 NYSE:RDDT is breaking out of this down trend after failing to break out of the flag mentioned in a previous idea https://www.tradingview.com/chart/RDDT/lApYwMj8-Reddit-gimme-gimme/ it has nullified the META competitor app news and breakout out of the down trendline new with a potential inverse head and shoulder also in play... Read more
 -
XAUUSD 1H
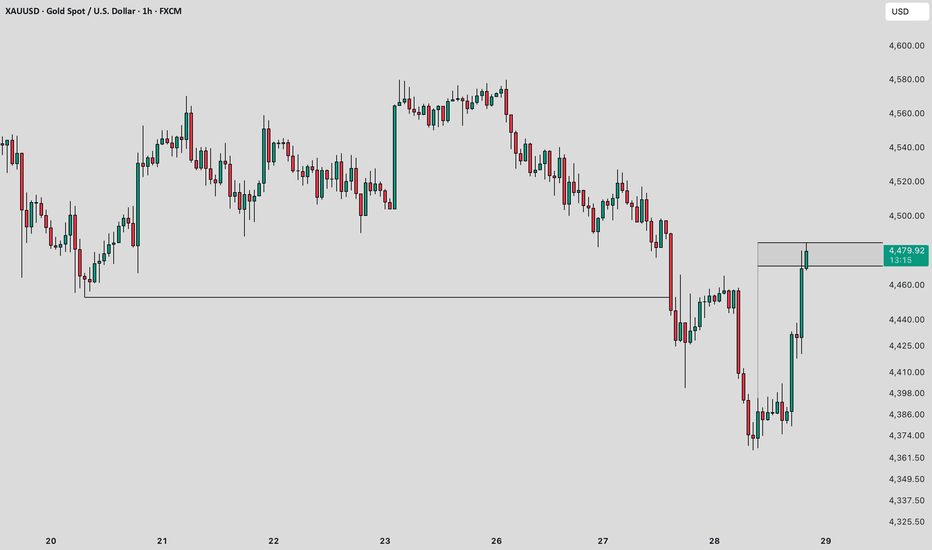 Chart Concept & Observation : The highlighted box in this chart represents a potential support and resistance zone, where price has historically reacted and may continue to do so. If any bullish or bearish price action pattern / candlestick formation appears near the upper or lower boundary of this box, it may indicate a possible reversal opportunity. In some cases, the market may also respect the midpoint (50% level) of the box. Therefore, any significant price action signal forming around this level can also lead to a potential reversal. Additionally, if liquidity zones/lines are marked above or below the box, price may be drawn toward those areas before reacting. For better reversal confirmation, lower timeframe analysis can also be used to refine entries. This framework helps in identifying key reaction zones, but it should always be used in conjunction with proper confirmation and risk management. Disclaimer : This chart is... Read more
 -
Long ACHR
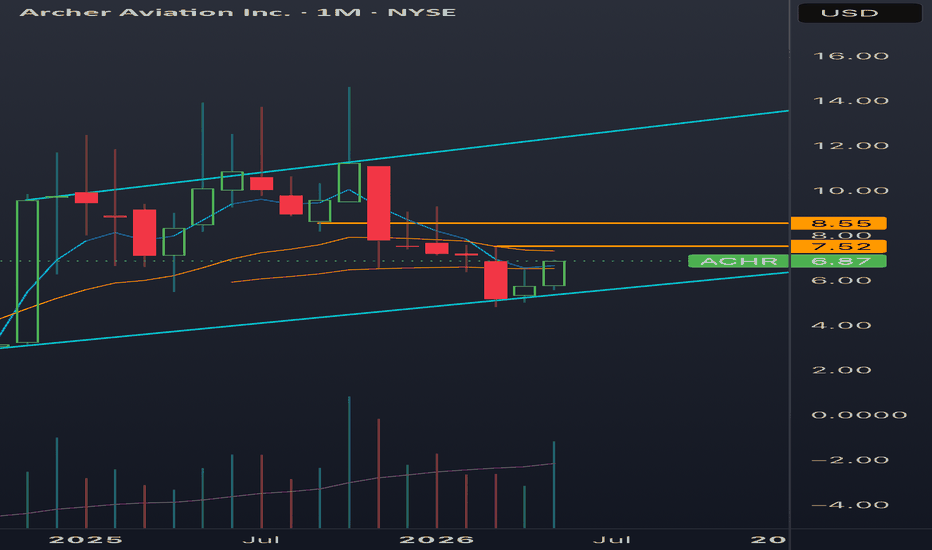 ACHR is setting up for another huge run on this drone and military growth stock hype. I expect a quick test of 7.5 and 8.5 in short order with the monthly upside at the top of the marked range.... Read more
 -
NIFTY Levels for May 29, 2026
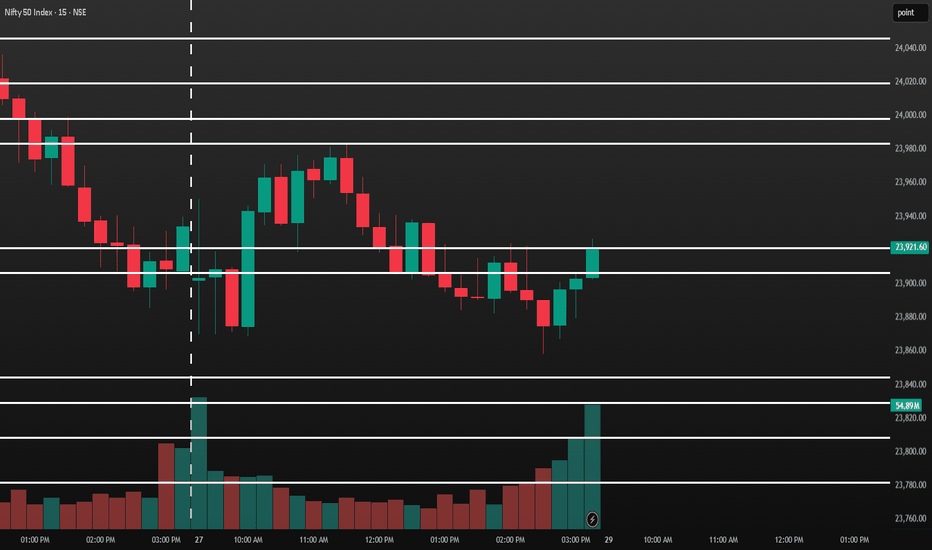 Level Type: Nifty 50 Levels Market Context / Trading Strategy: Major Resistance: 23,907 - 23,983 Wednesday's close and structural high. Capped heavily for the near term. Immediate Resistance: 23,750 The Key Session Pivot (20-day EMA). Any intraday pullback is highly likely to face selling pressure here. Expected Opening Zone: 23,580 - 23,640 The projected opening territory based on early global futures. Immediate Support: 23,550 The immediate derivative put-writing wall where the initial opening sell-off needs to cool off. Major Support: 23,400 - 23,450 Deep value zone. If 23,550 cracks cleanly on a 15-minute closing basis, the doors open to this structural floor. ----------------------------------------------------------------------------------------------------------------------... Read more
 -
50 SMA Strategy - $ARES
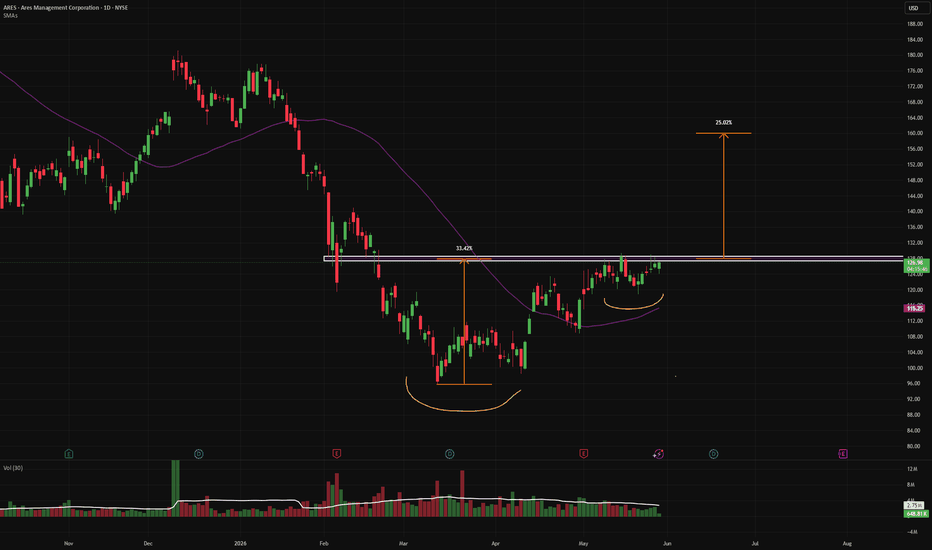 50 SMA Strategy Potential cup & handle breakout Rising buyers volume Breakout above 128.5$ Next target - 160$ Stop - under 127$... Read more
 -
USD/JPY | USDJPY Finally Filled The Major FVG , Reversal Coming?
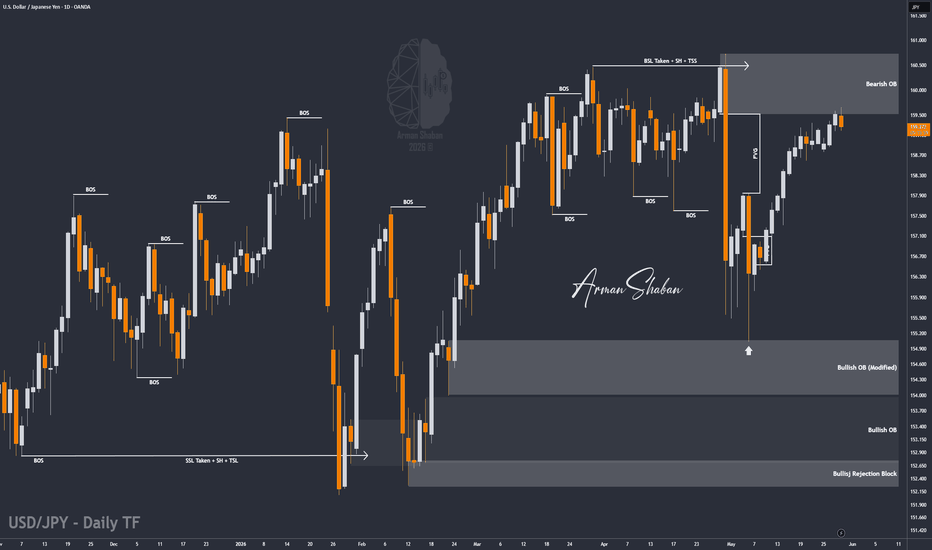 By analyzing the #USDJPY chart on the 4H timeframe, we can see that price finally completed the bullish retracement scenario perfectly. USDJPY pushed all the way toward the 159.50 region and successfully filled the large FVG that we had marked on the chart. Currently, price is trading around 159.20 and this area is becoming a very important supply and resistance zone. In my view, the probability of a larger bearish move from this region is increasing, especially after the full liquidity rebalance and FVG fill. From a structural perspective, the nearest supply zones are now located around 159.20 – 160.00, followed by the stronger resistance cluster between 160.50 – 161.20. On the downside, the closest demand zones are sitting around 157.00 – 157.50, with deeper structural support near 155.00 – 155.50. If sellers regain full control from this region, the next short-term and mid-term bearish targets to monitor are 158.00,... Read more
 -
ATPC Bull-Flag setup
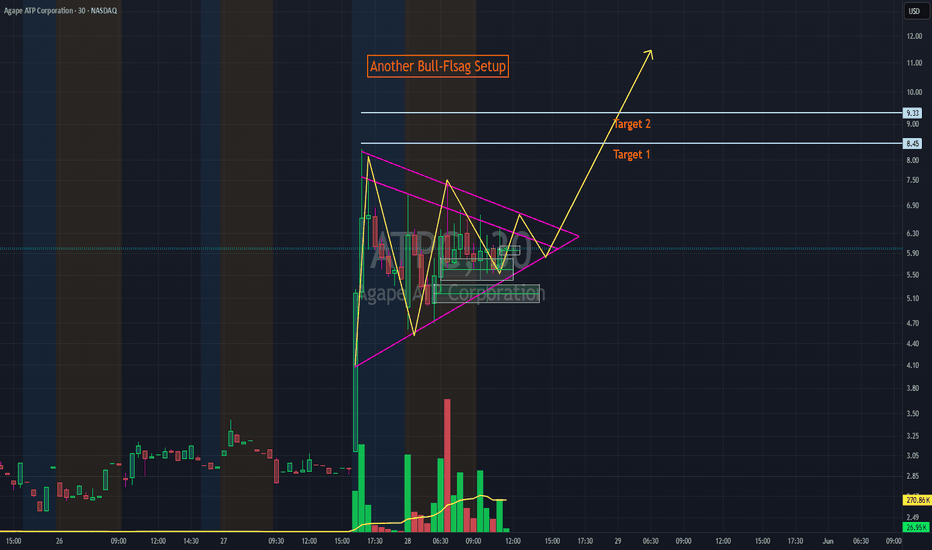 ATPC — Bull-Flag Setup Building for Possible Upside Continuation ATPC is setting up beautifully here. After the explosive move, price did not collapse — instead, it started tightening inside a bull-flag / triangle structure while holding key support. That is exactly the kind of consolidation I like to watch before a possible second leg higher. The bullish signs are there: price is holding above support, volume has cooled off during the pullback, and the chart is compressing near the breakout zone. If buyers step back in with strong volume, this can move fast. The key breakout area I’m watching is $6.30–$6.50. A clean break above that zone with volume can open the door toward $8.45 first, followed by $9.33–$9.95 as the next major upside target zone. If momentum really kicks in, the extended move can push toward the $11+ area. My bullish roadmap: Hold $5.60 support → Break $6.50 resistance... Read more
 -
Bitcoin - Update 28.05.2026
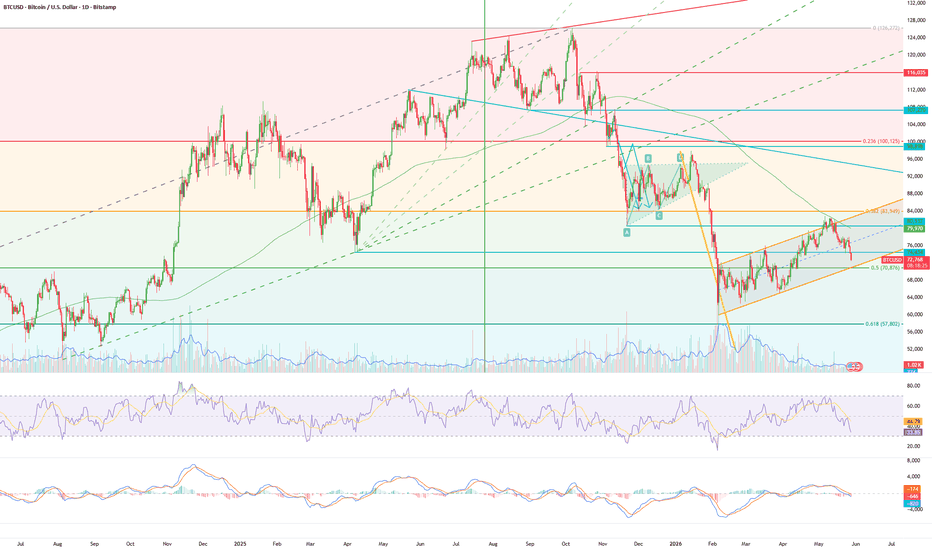 The failed breakout attempt at the upper channel boundary has painfully exposed the lack of further buyers. As prices rose over the past few weeks, we saw a steady decline in volume, which signaled the structural weakness of this rally from the very beginning. With follow-through buying failing to materialize, sellers have now regained control. At the same time, the fundamental environment is visibly deteriorating. Crypto sentiment remains deep in the fear zone, which is noticeably depriving the market of the necessary liquidity, as buy orders are being placed deeper and deeper in the order book. There is currently no tailwind from the macro level either, as a temporary shortage of global liquidity is blocking the necessary fuel for a breakout. Bitcoin now faces a critical decision on its direction and is approaching the lower channel boundary in the current momentum. The RSI and MACD are already reflecting this dynamic... Read more
 -
CADCHF Formed a Bearish flag /rising Wedge
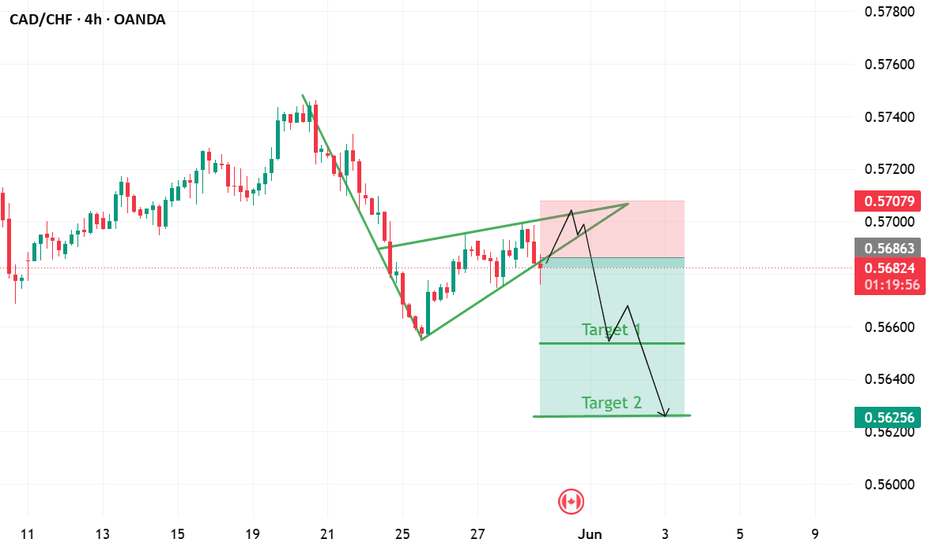 CADCHF has fromed the rising wede pattern indidcatin the fall will soon resume, let us see how it plays out.... Read more
 -
Litecoin Explosive Rally Incoming LTC USD
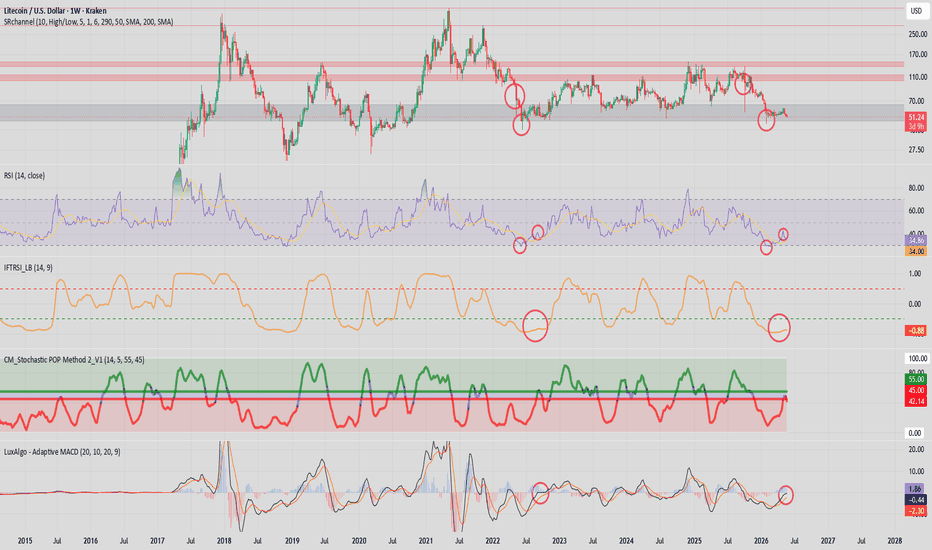 I havent done charts in a while and I apologize but Ive been extremely busy with some new ventures and its been sideways anyways. I believe that we are entering the final stages of this almost 8 year consolidation. The chart and the indicators are pointing to a massive rally for Litecoin starting probably in June. What I dont know is whether or not this is going to be extremely explosive and fast or whether it will be a long multi year bull market. My initial thoughts are that this rally will be explosive and fast. I believe that once it starts within 6 to 8 months the top will be in. This is a mid cycle correction for Bitcoin in my opinion. The final blow off top for this cycle for Bitcoin is coming and this will propel Litecoin to new all time highs similar to the 2017 rally... Read more
 -
BTCUSD 1D
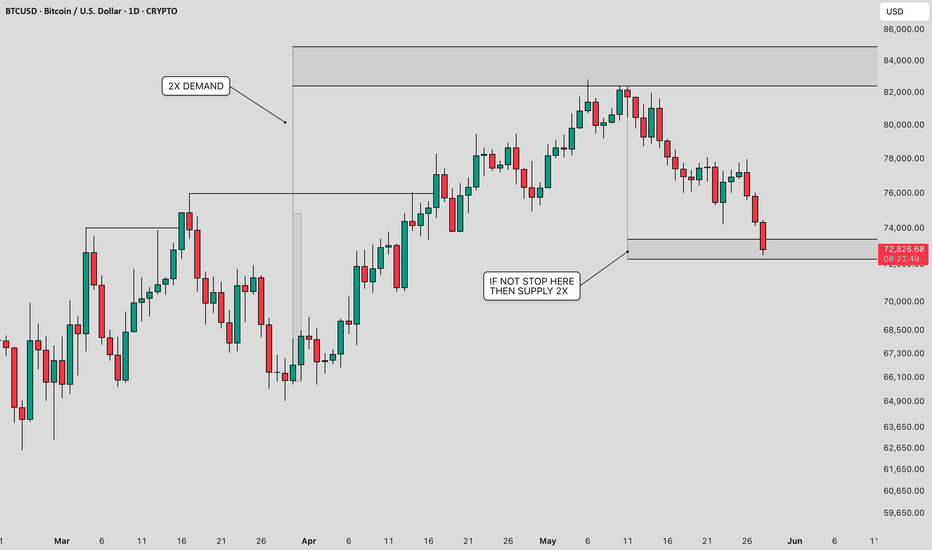 Chart Concept & Observation : The highlighted box in this chart represents a potential support and resistance zone, where price has historically reacted and may continue to do so. If any bullish or bearish price action pattern / candlestick formation appears near the upper or lower boundary of this box, it may indicate a possible reversal opportunity. In some cases, the market may also respect the midpoint (50% level) of the box. Therefore, any significant price action signal forming around this level can also lead to a potential reversal. Additionally, if liquidity zones/lines are marked above or below the box, price may be drawn toward those areas before reacting. For better reversal confirmation, lower timeframe analysis can also be used to refine entries. This framework helps in identifying key reaction zones, but it should always be used in conjunction with proper confirmation and risk management. Disclaimer : This chart is... Read more
 -
PGR SHORT
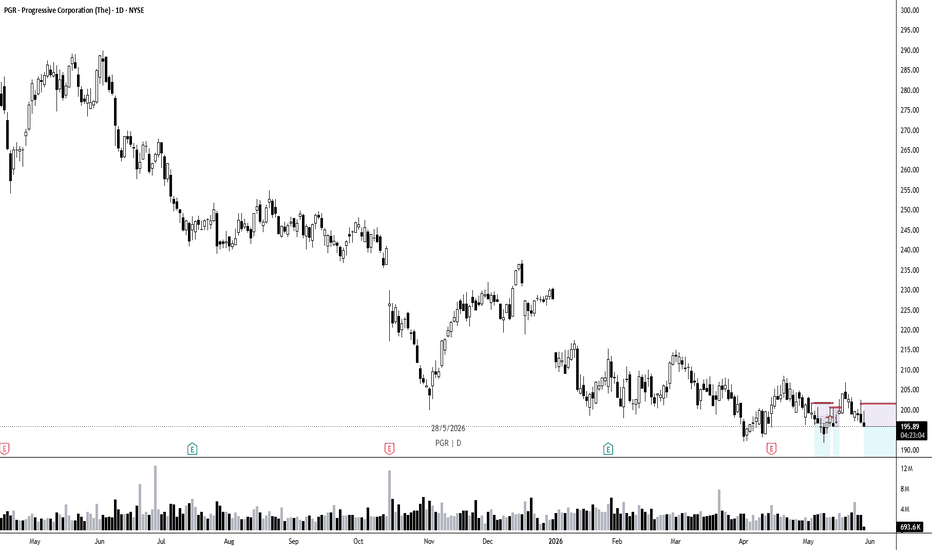 🔘 Entry points when strong global levels are broken 🔘 There is no clear take profit target - the position is accompanied by different algorithms 🔘 Use Tradingview as the most convenient way to visualize and interactively track positions... Read more
Market Analysis
No feed items found.