Above the Green Line -01
  • Market Insights
        • Commentary
          • Daily
          • Weekly
        • BUY / SELL SIGNALS
          • Trade Posts
          • Recent Trade Alerts
          • Recent Day Trades
        • BLOGROLL
          • Dividend Growth Blog
          • ETF Sector Blog
          • Dow Dogs
          • TPOW Blog
  • Strategies
        • SWING TRADING
          • Current Positions
          • Watchlists
          • Closed Positions
          • Candidates - TOP 100
          • Specialty Stocks
        • WEEKLY STOCK PICK
          • TPOW Charts
          • TPOW Performance
          • TPOW Strategy Guide
          • TPOW Performance Dashboard
        • DAY TRADING
          • Watch List
        • ATGL DASHBOARD
        • ETF STRATEGIES
          • ETF Sector Rotation
          • ETF Sector Portfolio
        • DIVIDEND GROWTH
          • Dividend Growth Portfolio
          • Dividend Calendar
        • DOGS OF THE DOW
          • Dogs of the Dow Portfolio
          • DOW 5 Portfolio
  • Markets
        • US MARKET
          • Commodities
          • Energy
          • Precious Metals
          • Volatility
        • GLOBAL MARKETS
          • Market Indices
          • Economic Calendar
          • FOREX Heat Map
          • FOREX Cross Rates
          • Crypto Currency Market
  • Investing
    • Discord Community
    • Dashboard
  • Resources
        • ARTICLES
          • Dividend Growth Model Articles
          • ETF Articles
          • Investment Strategies Articles
          • Market and Economic Insights
          • Stock Trade Articles
          • Stock Reviews
        • TOOLS
          • Stock Scanners
          • Charting Software
          • Brokerage Firms
        • STOCK CHARTS
          • Key Components
          • Reading Charts
          • Drawing Stock Charts
          • Identifying Trends
        • RETIREMENT PLANNING
  • About
    • Contact Us
    • How to Win
    • #1 At Stockcharts
    • Disclaimer
    • FAQ
  • Log In
  • Subscribe

April 7, 2021

Money Wave Alert! Apr 7, 2021

XCI Chart
The Tech Fund (XCI) is near Highs, but the Relative Strength is down to 67.

Markets were mixed again today, but have been going sideways for almost 2 days. This probably means that another quick burp up is coming with some Good News. The S&P 500 and DOW 30 Indices are near all time Highs again, but the Small Caps and NASDAQ 100 Funds are struggling to catch up, and need to make New Highs also for this rally to continue.

Most of the Leaders are slowly coming down from the Red Zones (probably too late to Buy for the Short Term).  Please be patient and WAIT for pull-backs. The better trades happen when the S&P 500 Index is also in the Green Zone. 

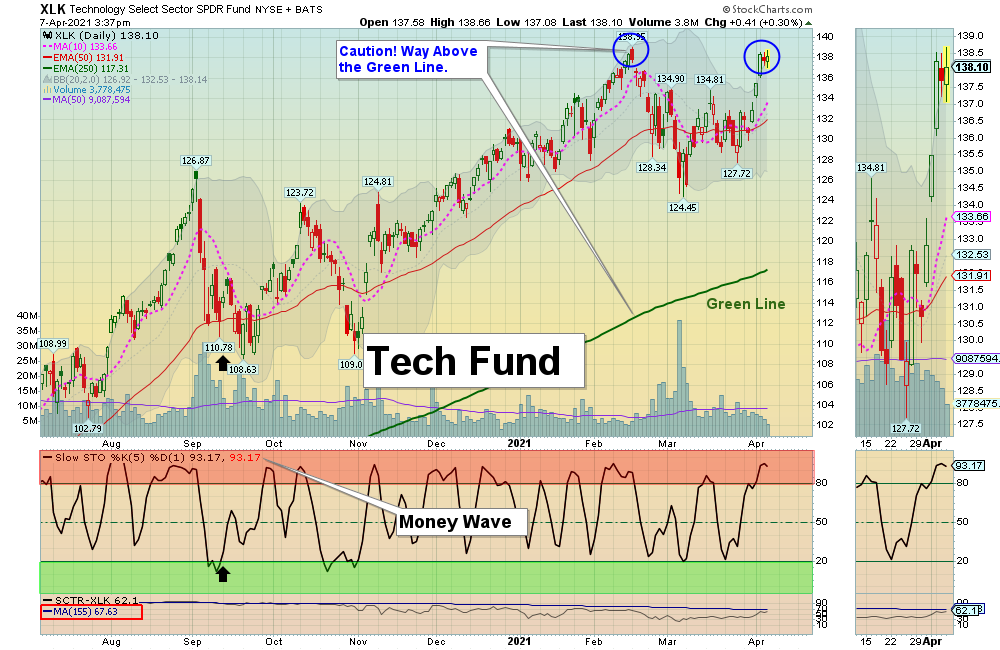
The Big Tech Stocks have perked up recently, and are back up near Resistance. Most have Below 80 Relative Strength required for Large Cap Stocks. This is because they are moving up slower than the Strongest Leaders, and most Big Funds are already loaded up with Big Techs.

More new adds to the DAY TRADING SETUPS.

Bonds  were down slightly today, and are below the Green Line.

Crude Oil was up $0.28 today at $59.61.

BUYS TODAY    4/7/2021       

PLAY      DAVE & BUSTER’S      Money Wave Buy today, but PLAY will not be Bought or logged as the Volume is below average of 1.6 MIL.

We will “Not Log” trades if the Reward/Risk is not at least 2:1, or Low Volume.  These have more risk.   

JUMP START: (Buy Signal should be very soon… Click on the Jump Start link for more info.)      

BNGO      BIONANO GENOMICS      Buy above $8.43 with High Volume with a 5% Trailing Sell Stop Loss below it.

____________________________________________________________________________________________________________

WATCH LIST

WATCH LIST SCROLLING CHARTS (Real Time)       

AMRS      AMYRIS INC.      Wait for Money Wave Close > 20 with High Volume.  

DDD      3D SYSTEMS CORP.      Buy above $29.00 with High Volume with a 5% Trailing Sell Stop Loss below it.     

OXY      OCCIDENTAL PETE.      Wait for Money Wave Close > 20 with High Volume.  

VET      VERMILLION ENERGY INC.      Wait for Money Wave Close > 20 with High Volume. 

ZKIN     ZK INT’L. GROUP      Wait for Money Wave Close > 20 with High Volume. (2nd Money Wave Buy soon.)    

Please be patient and wait for Money Wave Buy Signals.  We will email you when they are ready. Follow on the WATCH LIST.
Emotions are very high now, so please do not Buy unless you are VERY NIMBLE.

The Leaders are Way Above the Green Lines (all Investments eventually return to their Green Lines).      

____________________________________________________________________________________________________________

SELLS TODAY   

MRO      MARATHON OIL      EXIT if it is going to Close below the Pink Line around $10.96.  

TRIP      TRIPADVISOR INC.      EXIT if it is going to Close below the Pink Line around $53.85.  This trade was not logged.

VUZI      VUZIX CORP.      Target was Hit at $28 today for a 10 % Gain. This trade was not logged.     

ZKIN      ZK INT’L. GROUP      LOWER the Sell Stop Loss below the Red Line of $7.29. ZKIN is back down in the Green Zone.

Please update your Sell Stops.    

Click for  CURRENT POSITION CHARTS – Real Time  (Please check and adjust your Sell Stops).         
Click for  CLOSED POSITIONS,   
NEW:       MY TRADING DASHBOARD

DAY TRADING SETUPS
NEW:  TRADE ALERTS
ARE YOUR INVESTMENTS ABOVE THE GREEN LINE?
ETF SECTOR ROTATION SYSTEM   
TOP 100 LIST Updated Apr 4, 2021

Many like to Buy the day before, near the Close, if the Money Wave is going to create a Buy Signal (Closing > 20 and out of the Green Zone).

Don’t Buy if the Investment has already popped up too much. Money Wave Buys are usually good for a 3-6 %  move in a few days.

We will “Not Log” trades if the Reward/Risk is not at least 2:1, or Low Volume. These have more risk.   

Related Post

– Money Wave Alert! Apr 6, 2021

Subscribe to Our Newsletter

AGL Logo

Get our eBook Now!

Candlestick - A Swing Traders Friend

We don’t spam! Read our privacy policy for more info.

You’ve been successfully subscribed to our newsletter!

Voted #1 at Stock Charts

SH Chart
Inverse S&P 500 Fund (SH) will have a Money Wave Buy today.

Help Us Help Animals

Help Us Help Animals

Recent Comments

  • Market Breadth Indicators: A Trader’s Guide to Early Trend Detection on Backtesting: Definition and How a Trading Strategy Backtest Works
  • Island Reversal Pattern: Definition and Formation Explained on Double Top Pattern: How to Identify and Trade This Reversal Signal
  • Channel Pattern Guide: What It Is and Why It Matters on A Guide to Forecasting Using Moving Averages
  • What Is a Broadening Bottom Chart Pattern? Full Guide on Bull vs. Bear Market: An Investor’s Guide to Market Phases
  • ATGL Weekly Money Flow - 2025-05-11 on ATGL Top Pick of the Week! Apr 6, 2025

Become a Green Liner!

Help me make more Money in the Stock Market.

ON ATGL

  • DashBoard
  • Weekly Commentary
  • Daily Buy / Sell Signals
  • Day Trade Setup
  • Trading Rooms

Design & Develop By Pixelvect

STRATEGIES

  • Swing Trading
  • ATGL Pick of the Week
  • Dividend Growth
  • ETF Sector Rotation
  • Dogs of the Dow

HELP

  • ATGL Trading Rules
  • FAQ
  • Account Maintenance
  • Contact US
  • Join

FOLLOW US

Instagram Linkedin Twitter Facebook

© COPYRIGHT 2024 · ABOVETHEGREENLINE.COM · ALL RIGHTS RESERVED · PRIVACY · TERMS · CONTACT · WATCHLIST · CURRENT