
Candlestick Charts Explained
Candlestick charts are one of the most popular and widely used tools in technical analysis. These charts provide a visual representation of a stock’s price movements over a specific time period and are particularly valued for the detailed information they offer. By using candlesticks, investors and traders can gain insights into market sentiment, potential price reversals, and overall trends. In this guide, we will explore what candlestick charts are, how they work, and how to interpret their components and patterns to make informed investment decisions.
What is a Candlestick Chart?
A candlestick chart consists of a series of “candlesticks,” each representing the price movement of a stock (or any other asset) over a specific time frame, such as one minute, one hour, one day, or even one month. Each candlestick on the chart contains four key pieces of information:
- Open Price: The price of the stock at the beginning of the time period.
- Close Price: The price of the stock at the end of the time period.
- High Price: The highest price reached during the time period.
- Low Price: The lowest price reached during the time period.
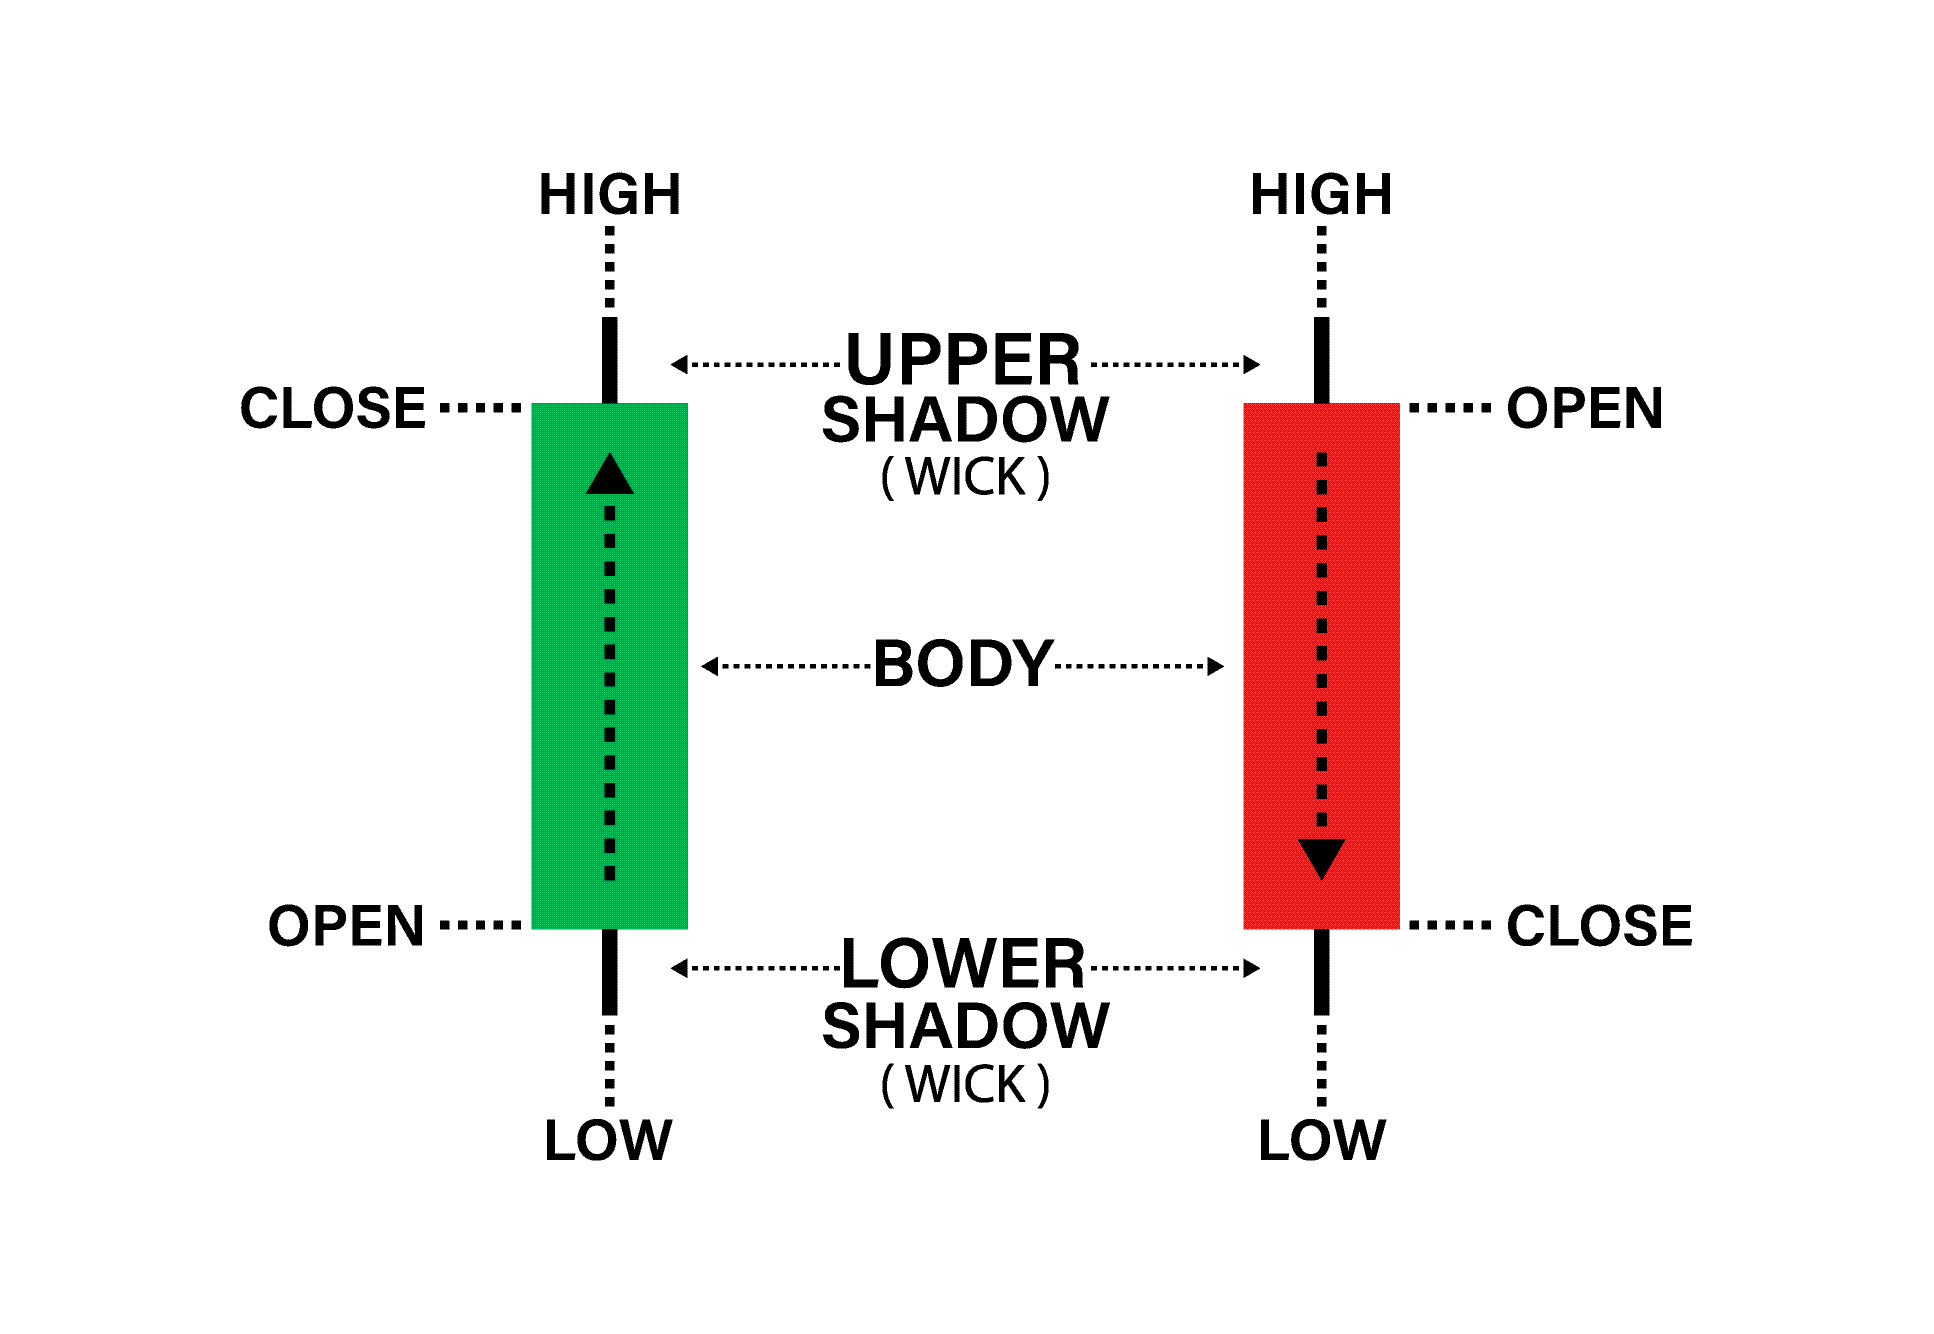
A candlestick consists of a body (the rectangular area) and two lines (or “shadows” or “wicks”) extending above and below the body. These components convey important details about price action, helping to assess market behavior and trends.
Structure of a Candlestick
Understanding the structure of a candlestick is essential for interpreting the chart correctly. The candlestick consists of the following parts:
1. Body:
The rectangular area of the candlestick, called the body, represents the range between the open and close prices for the period. If the closing price is higher than the opening price, the body is usually hollow or colored green/white (indicating a bullish or upward movement). If the closing price is lower than the opening price, the body is filled or colored red/black (indicating a bearish or downward movement).
2. Wicks (or Shadows):
The thin lines above and below the body are called wicks or shadows. These represent the high and low prices for the given time period:
- The upper wick shows the high price.
- The lower wick shows the low price.
Together, the body and wicks provide a complete picture of the price range for that particular time period, giving traders crucial information about the stock’s volatility and market sentiment.
Interpreting Candlestick Patterns
Candlestick charts are powerful because they not only provide price information but also help identify specific candlestick patterns. These patterns can be used to predict future price movements and market behavior. Let’s explore some of the most important candlestick patterns and their significance.
1. Bullish Patterns
These patterns suggest that the price of a stock is likely to increase, signaling a potential buying opportunity.
- Bullish Engulfing: This occurs when a small red candlestick (representing a down day) is followed by a large green candlestick (representing an up day), completely engulfing the previous day’s price action. This pattern indicates a shift in sentiment from bearish to bullish.
- Hammer: A hammer candlestick has a small body near the top of the price range with a long lower wick. It suggests that the stock found strong support at the low, and a potential reversal to the upside may occur.
- Morning Star: This is a three-candlestick pattern consisting of a long red candle (bearish), followed by a small-bodied candle (which can be red or green), and then a large green candle (bullish). The morning star pattern signals a reversal from a downtrend to an uptrend.
2. Bearish Patterns
These patterns suggest that the price of a stock is likely to decrease, signaling a potential selling opportunity.
- Bearish Engulfing: This pattern occurs when a small green candlestick (representing an up day) is followed by a large red candlestick (representing a down day) that completely engulfs the previous day’s price action. This pattern signals a potential reversal from bullish to bearish.
- Shooting Star: A shooting star is a candlestick with a small body near the bottom of the price range and a long upper wick. It indicates that the stock surged higher but faced resistance, signaling a potential reversal from an uptrend to a downtrend.
- Evening Star: This three-candlestick pattern consists of a long green candle (bullish), followed by a small-bodied candle, and then a long red candle (bearish). It signals a reversal from an uptrend to a downtrend.
3. Neutral Patterns
Neutral patterns do not necessarily signal an immediate trend reversal but indicate indecision or consolidation.
- Doji: A doji candlestick has an almost identical open and close price, resulting in a very small body. The wicks can vary in length. A doji indicates indecision in the market, as neither buyers nor sellers have control. The following candlestick often provides clues as to the next direction.
- Spinning Top: A spinning top has a small body with long wicks above and below. It indicates indecision in the market, where neither bulls nor bears have dominance, and it typically precedes a period of consolidation.
How Candlestick Charts Help in Trading
Candlestick charts are extremely useful for traders because they provide quick, actionable insights into market sentiment and price action. By observing the size, color, and patterns of the candlesticks, traders can make more informed decisions about when to enter or exit a trade. Here are some of the key ways candlestick charts aid in trading:
-
Trend Reversals: Candlestick patterns are especially helpful in identifying trend reversals. For instance, a bullish engulfing pattern at the bottom of a downtrend may signal the start of an uptrend, while a shooting star at the top of an uptrend may indicate a reversal to a downtrend.
-
Confirmation: Candlestick charts can be used to confirm other technical analysis tools, such as trendlines, support, and resistance levels. If a price breaks a trendline with a strong candlestick pattern, it often confirms the breakout.
-
Price Action: By looking at the size and direction of the candlesticks, traders can gauge the momentum of a stock. Large green candlesticks with little to no wicks show strong bullish momentum, while large red candlesticks indicate strong bearish momentum.
Conclusion
Candlestick charts are an indispensable tool for traders and investors, offering a clear visual representation of price action and market sentiment. With the ability to convey information about opening, closing, high, and low prices, candlestick charts provide far more depth than simple line charts. By learning how to recognize and interpret candlestick patterns, traders can anticipate potential price reversals, confirm trends, and make more informed decisions.
Whether you are a beginner or an experienced trader, mastering candlestick charts will significantly enhance your ability to analyze the market and spot profitable trading opportunities. As you dive deeper into the world of candlestick charting, remember that practice and experience are key to becoming proficient in identifying patterns and making successful trades.
Unlock the secrets of candlestick charting with our free ebook! Learn how to master candlestick patterns and use them to make more informed trading decisions. Download your copy today and start enhancing your market analysis skills!
