Above the Green Line -01
  • Market Insights
        • Commentary
          • Daily
          • Weekly
        • BUY / SELL SIGNALS
          • Trade Posts
          • Recent Trade Alerts
          • Recent Day Trades
        • BLOGROLL
          • Dividend Growth Blog
          • ETF Sector Blog
          • Dow Dogs
          • TPOW Blog
  • Strategies
        • SWING TRADING
          • Current Positions
          • Watchlists
          • Closed Positions
          • Candidates - TOP 100
          • Specialty Stocks
        • WEEKLY STOCK PICK
          • TPOW Charts
          • TPOW Performance
          • TPOW Strategy Guide
          • TPOW Performance Dashboard
        • DAY TRADING
          • Watch List
        • ATGL DASHBOARD
        • ETF STRATEGIES
          • ETF Sector Rotation
          • ETF Sector Portfolio
        • DIVIDEND GROWTH
          • Dividend Growth Portfolio
          • Dividend Calendar
        • DOGS OF THE DOW
          • Dogs of the Dow Portfolio
          • DOW 5 Portfolio
  • Markets
        • US MARKET
          • Commodities
          • Energy
          • Precious Metals
          • Volatility
        • GLOBAL MARKETS
          • Market Indices
          • Economic Calendar
          • FOREX Heat Map
          • FOREX Cross Rates
          • Crypto Currency Market
  • Investing
    • Discord Community
    • Dashboard
  • Resources
        • ARTICLES
          • Dividend Growth Model Articles
          • ETF Articles
          • Investment Strategies Articles
          • Market and Economic Insights
          • Stock Trade Articles
          • Stock Reviews
        • TOOLS
          • Stock Scanners
          • Charting Software
          • Brokerage Firms
        • STOCK CHARTS
          • Key Components
          • Reading Charts
          • Drawing Stock Charts
          • Identifying Trends
        • RETIREMENT PLANNING
  • About
    • Contact Us
    • How to Win
    • #1 At Stockcharts
    • Disclaimer
    • FAQ
  • Log In
  • Subscribe

May 18, 2018

Money Wave Alert! May 18, 2018

SPX Chart
S&P 500 is trying to Hold above the 10-day avg. (Pink Line).


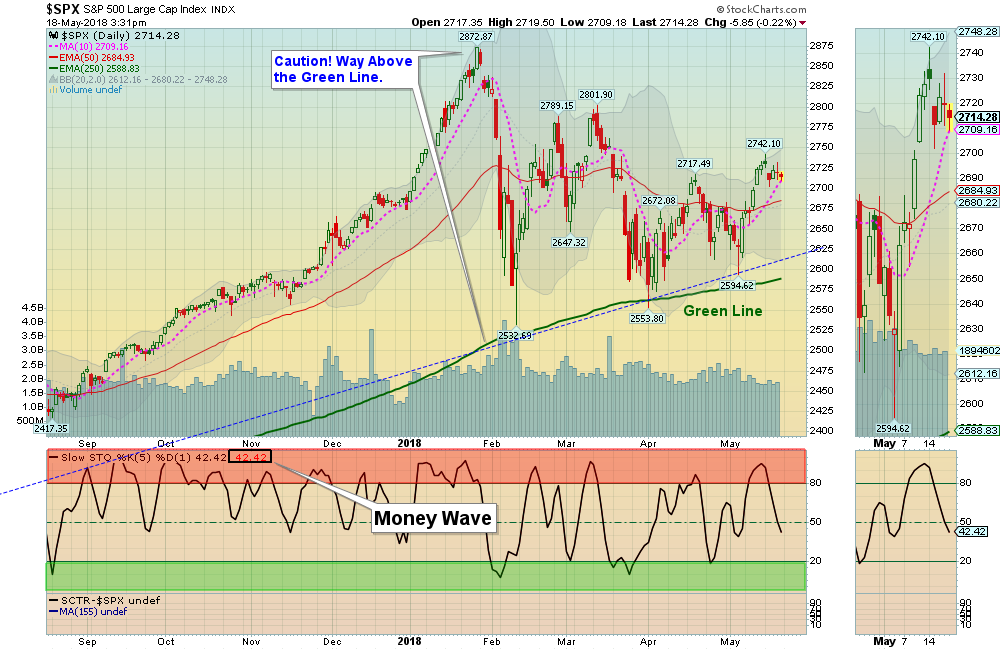
Markets were very slow today, as the Indices have not been able to exceed Monday’s Highs. The S&P 500 is trying to stay above the Pink Line (10-day avg.) around 2709 to avoid going into a Short Term Sell Signal.

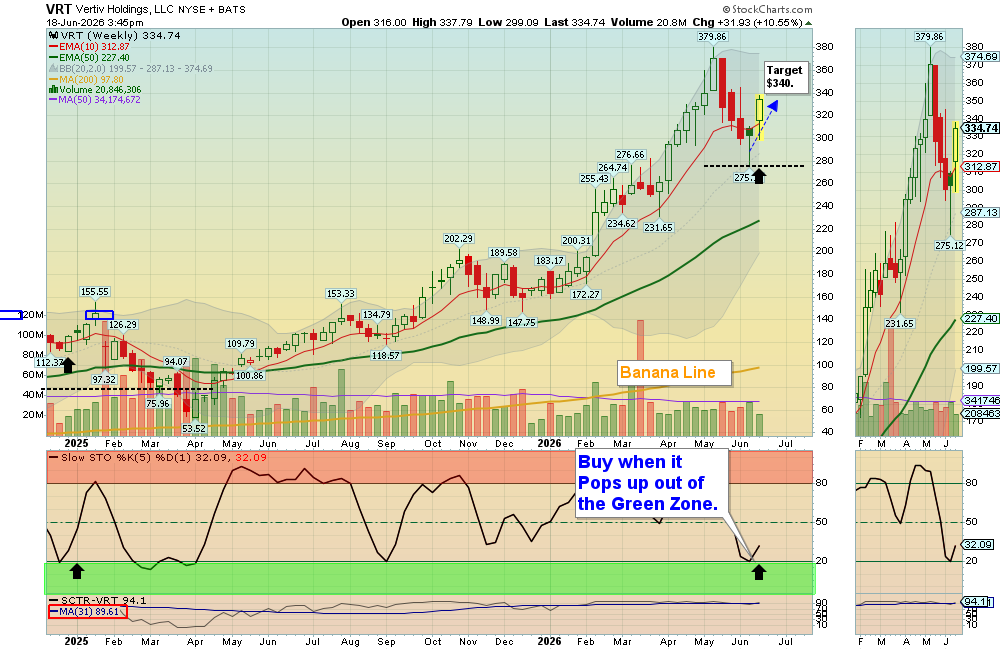
Please be patient, and WAIT for the Leading Investments to return to the Green Zones for more Money Wave Buy Signals.

Crude Oil  was down today at $71.35.

_____________________________________________________________________________________

The Following Investments will probably have a Money Wave Buy Signal soon.
(Slow Stochastic Closing > 20) on today’s Close.


BUYS TODAY    NONE TODAY

The Relative Strength on     ERIC    ERICSSON TELEPHONE   has dropped below 90, so ERIC does not Follow the Rules.


Money Wave Buys soon for:

GERN    GERON CORP.    Money Wave must Close in the Green Zone.

HLF    HERBALIFE NUTRITION    

MLCO    MELCO RESORTS     Money Wave must Close in the Green Zone.

NIHD    NII HOLDINGS

RHT    RED HAT INC.   


Please be patient and wait for Money Wave Buy Signals.  We will email you when they are ready. Click on Watch List.

Emotions are very high now, so please do not Buy unless you are VERY NIMBLE. The Leaders are still Way Above the Green Lines (all Investments eventually return to their Green Lines).

______________________________________________________________________________________

SELLS TODAY   


EXIT    GBT   GLOBAL BLOOD    if it is going to Close below the Red Line of $48.08.

EXIT     MU    MICRON TECH    if it is going to Close below your Buy Price, or $53.39.


Please Check   PORTFOLIO  (Open Positions) and adjust your Sell Stops.

Click for  CLOSED POSITIONS.

Many like to Buy the day before, near the Close, if the Money Wave is going to create a Buy Signal (Closing > 20).

Don’t Buy if the Investment has already popped up too much. Money Wave Buys are usually good for a 3-6 %  move in a few days. We will “Not Log” trades if the Reward/Risk is not at least 2:1.

Related Post

– MLCO

Subscribe to Our Newsletter

AGL Logo

Get our eBook Now!

Candlestick - A Swing Traders Friend

We don’t spam! Read our privacy policy for more info.

You’ve been successfully subscribed to our newsletter!

Voted #1 at Stock Charts

SH Chart
Inverse S&P 500 Fund (SH) will have a Money Wave Buy today.

Help Us Help Animals

Help Us Help Animals

Recent Comments

  • Market Breadth Indicators: A Trader’s Guide to Early Trend Detection on Backtesting: Definition and How a Trading Strategy Backtest Works
  • Island Reversal Pattern: Definition and Formation Explained on Double Top Pattern: How to Identify and Trade This Reversal Signal
  • Channel Pattern Guide: What It Is and Why It Matters on A Guide to Forecasting Using Moving Averages
  • What Is a Broadening Bottom Chart Pattern? Full Guide on Bull vs. Bear Market: An Investor’s Guide to Market Phases
  • ATGL Weekly Money Flow - 2025-05-11 on ATGL Top Pick of the Week! Apr 6, 2025

Become a Green Liner!

Help me make more Money in the Stock Market.

ON ATGL

  • DashBoard
  • Weekly Commentary
  • Daily Buy / Sell Signals
  • Day Trade Setup
  • Trading Rooms

Design & Develop By Pixelvect

STRATEGIES

  • Swing Trading
  • ATGL Pick of the Week
  • Dividend Growth
  • ETF Sector Rotation
  • Dogs of the Dow

HELP

  • ATGL Trading Rules
  • FAQ
  • Account Maintenance
  • Contact US
  • Join

FOLLOW US

Instagram Linkedin Twitter Facebook

© COPYRIGHT 2024 · ABOVETHEGREENLINE.COM · ALL RIGHTS RESERVED · PRIVACY · TERMS · CONTACT · WATCHLIST · CURRENT