Above the Green Line -01
  • Market Insights
        • Commentary
          • Daily
          • Weekly
        • BUY / SELL SIGNALS
          • Trade Posts
          • Recent Trade Alerts
          • Recent Day Trades
        • BLOGROLL
          • Dividend Growth Blog
          • ETF Sector Blog
          • Dow Dogs
          • TPOW Blog
  • Strategies
        • SWING TRADING
          • Current Positions
          • Watchlists
          • Closed Positions
          • Candidates - TOP 100
          • Specialty Stocks
        • WEEKLY STOCK PICK
          • TPOW Charts
          • TPOW Performance
          • TPOW Strategy Guide
          • TPOW Performance Dashboard
        • DAY TRADING
          • Watch List
        • ATGL DASHBOARD
        • ETF STRATEGIES
          • ETF Sector Rotation
          • ETF Sector Portfolio
        • DIVIDEND GROWTH
          • Dividend Growth Portfolio
          • Dividend Calendar
        • DOGS OF THE DOW
          • Dogs of the Dow Portfolio
          • DOW 5 Portfolio
  • Markets
        • US MARKET
          • Commodities
          • Energy
          • Precious Metals
          • Volatility
        • GLOBAL MARKETS
          • Market Indices
          • Economic Calendar
          • FOREX Heat Map
          • FOREX Cross Rates
          • Crypto Currency Market
  • Investing
    • Discord Community
    • Dashboard
  • Resources
        • ARTICLES
          • Dividend Growth Model Articles
          • ETF Articles
          • Investment Strategies Articles
          • Market and Economic Insights
          • Stock Trade Articles
          • Stock Reviews
        • TOOLS
          • Stock Scanners
          • Charting Software
          • Brokerage Firms
        • STOCK CHARTS
          • Key Components
          • Reading Charts
          • Drawing Stock Charts
          • Identifying Trends
        • RETIREMENT PLANNING
  • About
    • Contact Us
    • How to Win
    • #1 At Stockcharts
    • Disclaimer
    • FAQ
  • Log In
  • Subscribe

December 31, 2017

Green Line Weekly Dec 31, 2017

SPX Chart
S&P 500 is in a Strong UpTrend, But Over-Bought.


12/31/2017:  Markets had a historic up move this year, with the Major Indices up more than 20%!  Historically, Investment results are better if you “Buy & Hold” during a strong up move, instead of Trading the move.

But If you are expecting the Markets to have another 20 + % gain in 2018, you could easily be disappointed. However it could be a great Trading year, and the Green Line Trading System could do very well. Trading works best with both Emotions (Fear & Greed) kicking in.

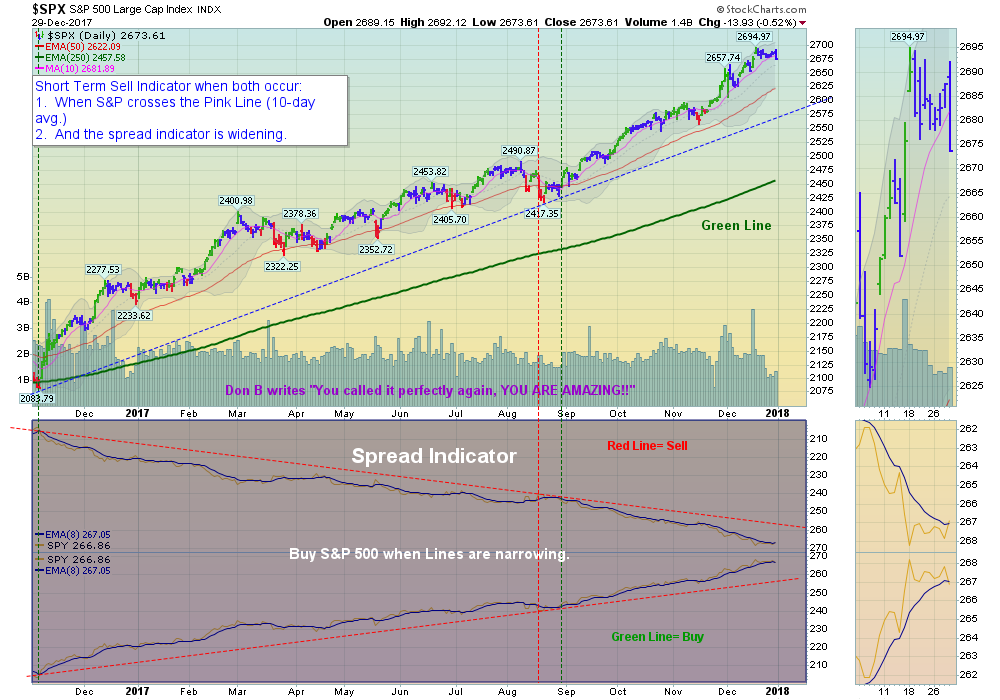
Since Nov 2016, there has been little FEAR, as the Markets have not Returned to the Green Line since then. Markets have not corrected well, so the Money Wave Buy Pops have been small… This will eventually change, as the liquidity of 8 years of FED Printing is gone, and now the FED is Raising Interest Rates.

Historically with a Strong Economy there will be Rising Interest Rates and Inflation. There are many Investments (ETF’s & Stocks) that should do very well with this environment. 

Many Sectors such as Copper, Coal, Oil, Rare Earth & Steel have started up now from long Bear or Down Markets. But the Volume has not been there to confirm good Break Outs (most do not Believe).  We want to see how these hold up when the Major Markets return to their Green Lines. Money eventually Flows to better Value (to where Tammy is not).

Markets are now in a “Goldilocks” Economy (Low Interest Rates, Low Inflation & Growing Earnings)… Many (or most) are “hoping” for more years of growing Earnings. We will see. When most agree…


Crude Oil was up  3,34% for the week at $60.42, and GOLD was up 2.39%.

___________________________________________________________________________________________

MONEY WAVE BUYS SOON:    We are currently in 2 logged Open Positions, for the Short Term. There are 5 Investments on the Short Term Watch List, so be patient and WAIT for Green Zone Buys!

______________________________________________________________________________________________

LONG TERM TRADES 

The Funds below are currently out of favor, but historically these could possibly Double or more from these lower levels. We are looking for a good Entry Point for these, but need the entire Economy  & Inflation to pick up speed:

DBC   COMMODITY FUND   Relative Strength is back Below 90.
GRPN   GROUPON INC.    Wait for Break Out above $5.99 on High Volume.
JJC     COPPER FUND       Wait for the next Green Zone Buy on the Daily Chart.
KOL    COAL FUND        Wait for the next Green Zone Buy on the Daily Chart.
LL   LUMBER LIQUIDATORS   Relative Strength is Below 90.
REMX   RARE EARTH FUND   Wait for Green Zone Buy on the Daily Chart.
TWTR   TWITTER INC.   Wait on Break Out Above $25.25.
UGA   US GASOLINE FUND     Volume is too low… Break Out Above $33.07.
VALE   VALE DE RIO    Wait for the next Green Zone Buy on the Daily Chart.

___________________________________________________________________________________________

Click for  Portfolio (Open Positions)  
Click for  Watch List
Click for  Closed Positions


Alert! Market Risk is HIGH (Red Zone). The probability of successful Short Term Trades is lower, when the S&P 500 is Way Above the Green Line. Even the Strongest Funds can get chopped up. Either take quick gains from Money Wave Pops, or STAY IN CASH & WAIT for a larger correction.

Tell your Friends about the Green Line, and Help Animals.

Related Post

– Green Line Weekly Dec 17, 2017

Subscribe to Our Newsletter

AGL Logo

Get our eBook Now!

Candlestick - A Swing Traders Friend

We don’t spam! Read our privacy policy for more info.

You’ve been successfully subscribed to our newsletter!

Voted #1 at Stock Charts

SH Chart
Inverse S&P 500 Fund (SH) will have a Money Wave Buy today.

Help Us Help Animals

Help Us Help Animals

Recent Comments

  • Market Breadth Indicators: A Trader’s Guide to Early Trend Detection on Backtesting: Definition and How a Trading Strategy Backtest Works
  • Island Reversal Pattern: Definition and Formation Explained on Double Top Pattern: How to Identify and Trade This Reversal Signal
  • Channel Pattern Guide: What It Is and Why It Matters on A Guide to Forecasting Using Moving Averages
  • What Is a Broadening Bottom Chart Pattern? Full Guide on Bull vs. Bear Market: An Investor’s Guide to Market Phases
  • ATGL Weekly Money Flow - 2025-05-11 on ATGL Top Pick of the Week! Apr 6, 2025

Become a Green Liner!

Help me make more Money in the Stock Market.

ON ATGL

  • DashBoard
  • Weekly Commentary
  • Daily Buy / Sell Signals
  • Day Trade Setup
  • Trading Rooms

Design & Develop By Pixelvect

STRATEGIES

  • Swing Trading
  • ATGL Pick of the Week
  • Dividend Growth
  • ETF Sector Rotation
  • Dogs of the Dow

HELP

  • ATGL Trading Rules
  • FAQ
  • Account Maintenance
  • Contact US
  • Join

FOLLOW US

Instagram Linkedin Twitter Facebook

© COPYRIGHT 2024 · ABOVETHEGREENLINE.COM · ALL RIGHTS RESERVED · PRIVACY · TERMS · CONTACT · WATCHLIST · CURRENT