Above the Green Line -01
  • Market Insights
        • Commentary
          • Daily
          • Weekly
        • BUY / SELL SIGNALS
          • Trade Posts
          • Recent Trade Alerts
          • Recent Day Trades
        • BLOGROLL
          • Dividend Growth Blog
          • ETF Sector Blog
          • Dow Dogs
          • TPOW Blog
  • Strategies
        • SWING TRADING
          • Current Positions
          • Watchlists
          • Closed Positions
          • Candidates - TOP 100
          • Specialty Stocks
        • WEEKLY STOCK PICK
          • TPOW Charts
          • TPOW Performance
          • TPOW Strategy Guide
          • TPOW Performance Dashboard
        • DAY TRADING
          • Watch List
        • ATGL DASHBOARD
        • ETF STRATEGIES
          • ETF Sector Rotation
          • ETF Sector Portfolio
        • DIVIDEND GROWTH
          • Dividend Growth Portfolio
          • Dividend Calendar
        • DOGS OF THE DOW
          • Dogs of the Dow Portfolio
          • DOW 5 Portfolio
  • Markets
        • US MARKET
          • Commodities
          • Energy
          • Precious Metals
          • Volatility
        • GLOBAL MARKETS
          • Market Indices
          • Economic Calendar
          • FOREX Heat Map
          • FOREX Cross Rates
          • Crypto Currency Market
  • Investing
    • Discord Community
    • Dashboard
  • Resources
        • ARTICLES
          • Dividend Growth Model Articles
          • ETF Articles
          • Investment Strategies Articles
          • Market and Economic Insights
          • Stock Trade Articles
          • Stock Reviews
        • TOOLS
          • Stock Scanners
          • Charting Software
          • Brokerage Firms
        • STOCK CHARTS
          • Key Components
          • Reading Charts
          • Drawing Stock Charts
          • Identifying Trends
        • RETIREMENT PLANNING
  • About
    • Contact Us
    • How to Win
    • #1 At Stockcharts
    • Disclaimer
    • FAQ
  • Log In
  • Subscribe

September 21, 2021

Money Wave Alert! Sep 21, 2021

DIA Chart
The DOW 30 Index (DIA) is the weakest and fell below the Red Line (50-day average).

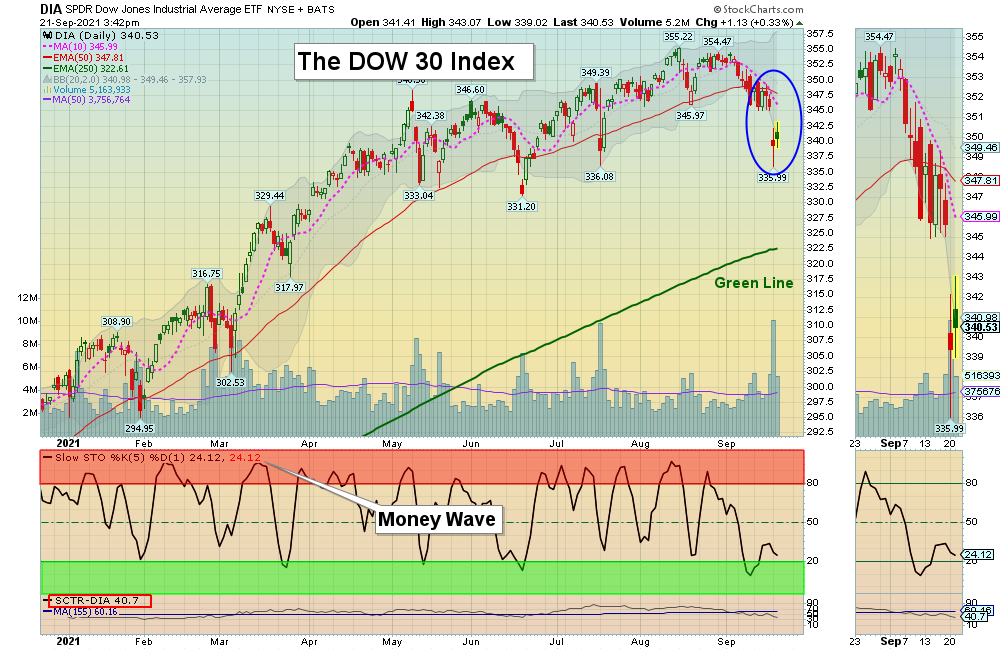
Markets were slightly higher today after yesterday’s drop. The Indices now have the Red Lines (50-day avgs.) as Short Term Resistance to Close above to attract more Buyers.

Buying was very mild as Investors are waiting to find a Short Term bottom on the Markets. The Markets should have enough momentum to rally back up near the Highs again, but now it might take several weeks. Try to only Buy new money investments that are still above the Red Lines, as they tend to bounce first.

New Investors:  The Indices have fallen below the 50-day averages, which might mean a larger correction before the next bounce. Normally we won’t see a big advance until the Volume picks up. The better trades happen when the S&P 500 Index is in the Green Zone.  

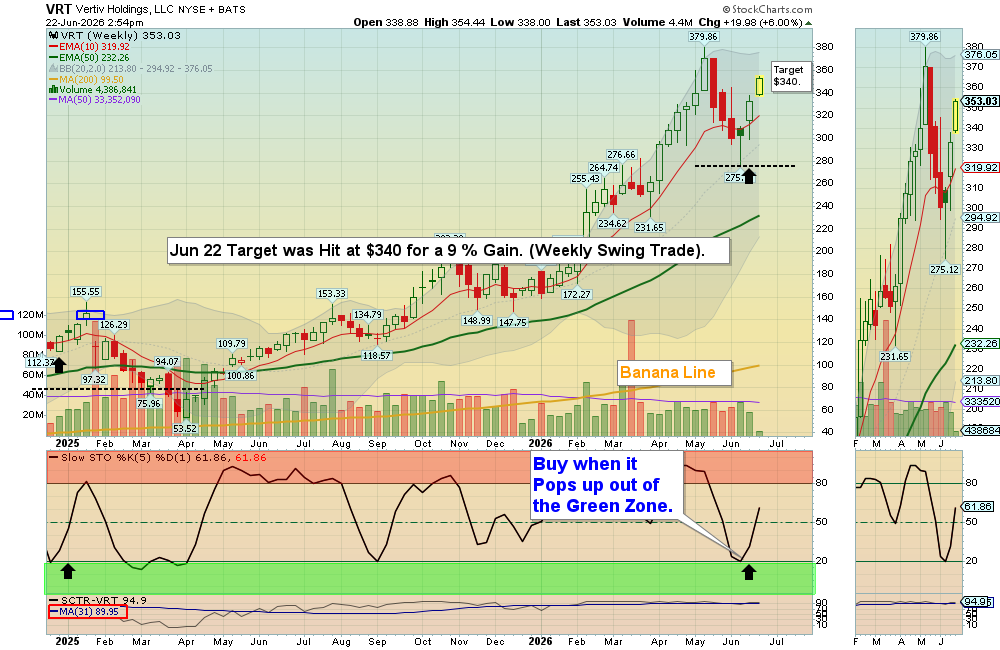
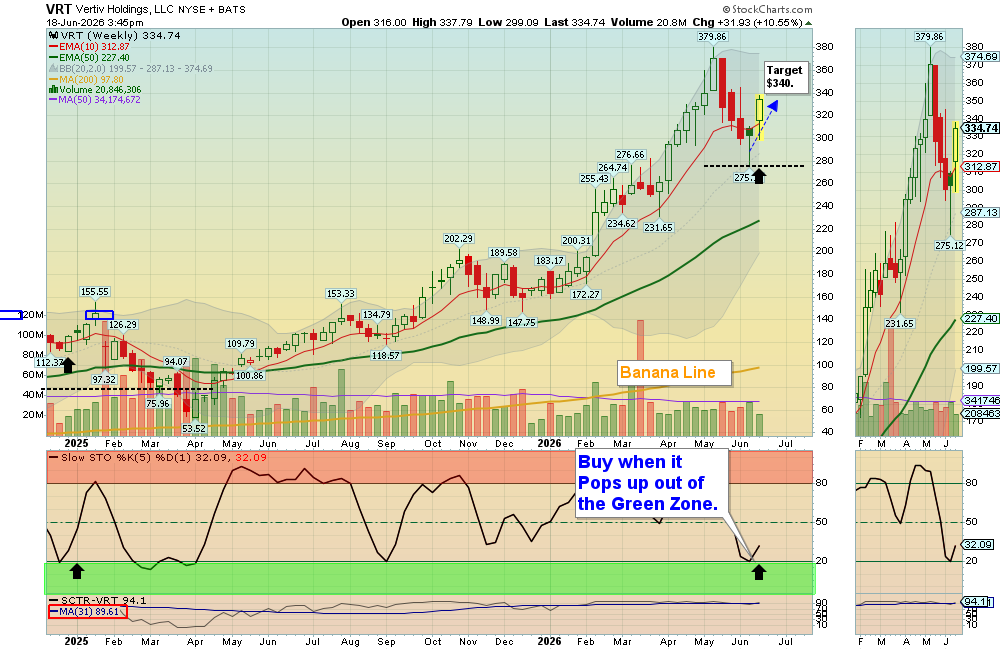
Triple Buys today for DNN (+6%) ANY (+%5) & XELA (+4%). Soon for AMC BBIG BTU OCGN GSAT IRNT & OPAD in DAY TRADING SETUPS. 

Bonds  were mixed today, but are Above the Green Line.

Crude Oil was up $0.62 today at $70.76.

BUYS TODAY    9/21/2021   

CHS      CHICOS FAS INC.     Traded above the Pink Line around $4.68 but CHS will not be bought or logged as the Volume is below average of 1.9 MIL. 

NVDA      NVIDIA INC.      Money Wave Buy today, but NVDA will not be bought or logged as the Volume is below average of 29 MIL.   

We will “Not Log” trades if the Reward/Risk is not at least 2:1, or Low Volume. These have more risk.

_________________________________________________________________________________________________

JUMP START SCROLLING CHARTS: (Buy Signal should be very soon… Click on the Jump Start link for more info.)     

BTU      PEABODY ENERGY      Wait for Money Wave Close > 20 with High Volume.  

GSM      FERROGLOBE PLC.      Wait for Money Wave Close > 20 with High Volume.     

_________________________________________________________________________________________________

WATCH LIST (Click here)       

WATCH LIST SCROLLING CHARTS (Real Time)                 

AMC      AMC ENTERTAINMENT      Wait for Money Wave Close > 20 with High Volume.   

BBIG      VINCO VENTURES INC.      Wait for Money Wave Close > 20 with High Volume.   

CCJ      CAMECO CORP.      Wait for Money Wave Close > 20 with High Volume.  

HUT      HUT 8 MINING CORP.      Wait for Money Wave Close > 20 with High Volume.    

UNG      US NATURAL GAS FUND      Wait for Money Wave Close > 20 with High Volume.   

Please be patient and wait for Money Wave Buy Signals.  We will email you when they are ready. Follow on the WATCH LIST.      
Emotions are very high now, so please do not Buy unless you are VERY NIMBLE.

The Leaders are Way Above the Green Lines (all Investments eventually return to their Green Lines).      

____________________________________________________________________________________________________________

SELLS TODAY    

AA      ALCOA CORP.      EXIT if it is going to Close below the Pink Line around $48.42. The Target was already Hit.     

Click for  CURRENT POSITION SCROLLING CHARTS – Real Time  (Please check and adjust your Sell Stops).     

Click for  CLOSED POSITIONS,   
NEW:       MY TRADING DASHBOARD
DAY TRADING SETUPS
NEW:  TRADE ALERTS
ARE YOUR INVESTMENTS ABOVE THE GREEN LINE?
ETF SECTOR ROTATION SYSTEM   
TOP 100 LIST Updated Sep 1, 2021

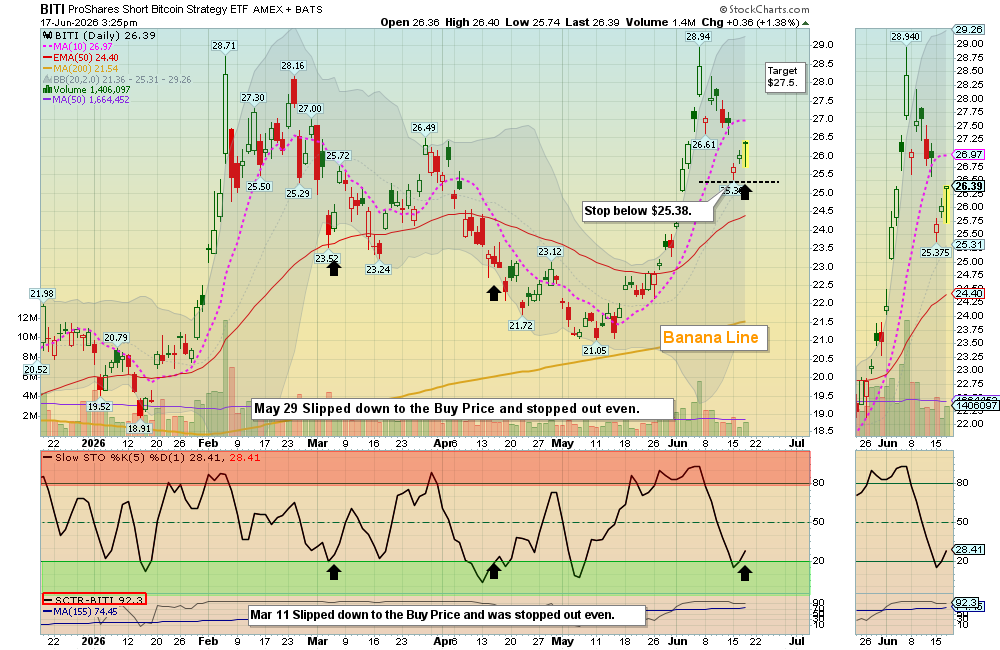
Many like to Buy the day before, near the Close, if the Money Wave is going to create a Buy Signal (Closing > 20 and out of the Green Zone).

Don’t Buy if the Investment has already popped up too much. Money Wave Buys are usually good for a 3-6 %  move in a few days.

We will “Not Log” trades if the Reward/Risk is not at least 2:1, or Low Volume. These have more risk.

Related Post

– Money Wave Alert! Sep 20, 2021

Subscribe to Our Newsletter

AGL Logo

Get our eBook Now!

Candlestick - A Swing Traders Friend

We don’t spam! Read our privacy policy for more info.

You’ve been successfully subscribed to our newsletter!

Voted #1 at Stock Charts

SH Chart
Inverse S&P 500 Fund (SH) will have a Money Wave Buy today.

Help Us Help Animals

Help Us Help Animals

Recent Comments

  • Market Breadth Indicators: A Trader’s Guide to Early Trend Detection on Backtesting: Definition and How a Trading Strategy Backtest Works
  • Island Reversal Pattern: Definition and Formation Explained on Double Top Pattern: How to Identify and Trade This Reversal Signal
  • Channel Pattern Guide: What It Is and Why It Matters on A Guide to Forecasting Using Moving Averages
  • What Is a Broadening Bottom Chart Pattern? Full Guide on Bull vs. Bear Market: An Investor’s Guide to Market Phases
  • ATGL Weekly Money Flow - 2025-05-11 on ATGL Top Pick of the Week! Apr 6, 2025

Become a Green Liner!

Help me make more Money in the Stock Market.

ON ATGL

  • DashBoard
  • Weekly Commentary
  • Daily Buy / Sell Signals
  • Day Trade Setup
  • Trading Rooms

Design & Develop By Pixelvect

STRATEGIES

  • Swing Trading
  • ATGL Pick of the Week
  • Dividend Growth
  • ETF Sector Rotation
  • Dogs of the Dow

HELP

  • ATGL Trading Rules
  • FAQ
  • Account Maintenance
  • Contact US
  • Join

FOLLOW US

Instagram Linkedin Twitter Facebook

© COPYRIGHT 2024 · ABOVETHEGREENLINE.COM · ALL RIGHTS RESERVED · PRIVACY · TERMS · CONTACT · WATCHLIST · CURRENT