Above the Green Line -01
  • Market Insights
        • Commentary
          • Daily
          • Weekly
        • BUY / SELL SIGNALS
          • Trade Posts
          • Recent Trade Alerts
          • Recent Day Trades
        • BLOGROLL
          • Dividend Growth Blog
          • ETF Sector Blog
          • Dow Dogs
          • TPOW Blog
  • Strategies
        • SWING TRADING
          • Current Positions
          • Watchlists
          • Closed Positions
          • Candidates - TOP 100
          • Specialty Stocks
        • WEEKLY STOCK PICK
          • TPOW Charts
          • TPOW Performance
          • TPOW Strategy Guide
          • TPOW Performance Dashboard
        • DAY TRADING
          • Watch List
        • ATGL DASHBOARD
        • ETF STRATEGIES
          • ETF Sector Rotation
          • ETF Sector Portfolio
        • DIVIDEND GROWTH
          • Dividend Growth Portfolio
          • Dividend Calendar
        • DOGS OF THE DOW
          • Dogs of the Dow Portfolio
          • DOW 5 Portfolio
  • Markets
        • US MARKET
          • Commodities
          • Energy
          • Precious Metals
          • Volatility
        • GLOBAL MARKETS
          • Market Indices
          • Economic Calendar
          • FOREX Heat Map
          • FOREX Cross Rates
          • Crypto Currency Market
  • Investing
    • Discord Community
    • Dashboard
  • Resources
        • ARTICLES
          • Dividend Growth Model Articles
          • ETF Articles
          • Investment Strategies Articles
          • Market and Economic Insights
          • Stock Trade Articles
          • Stock Reviews
        • TOOLS
          • Stock Scanners
          • Charting Software
          • Brokerage Firms
        • STOCK CHARTS
          • Key Components
          • Reading Charts
          • Drawing Stock Charts
          • Identifying Trends
        • RETIREMENT PLANNING
  • About
    • Contact Us
    • How to Win
    • #1 At Stockcharts
    • Disclaimer
    • FAQ
  • Log In
  • Subscribe

August 2, 2021

Money Wave Alert! Aug 2, 2021

SMH Chart
The Semiconductor Fund (SMH) made New Highs today.

Markets were mixed today after popping up this morning. Most the Indices were up in the Red Zones (probably too late to Buy for the Short Term). Semiconductors were strong. The other Indices need to catch up and make New Highs soon to keep this rally going.

NEW SUBSCRIBERS:  Most of the strongest Leaders are quickly back up in the Red Zones (probably too late to Buy for the Short Term). But we still have a few strong Stocks on the WatchList below that have pulled back 30-50%, and should have nice bounces back up soon when the Volume picks up. The better trades happen when the S&P 500 Index is also in the Green Zone (now back up in the Red Zone again). 

A few new adds today on DAY TRADING SETUPS.

Bonds  were up today, and are back above the Green Line.

Crude Oil was down $2.58 today at $71.37. 

BUYS TODAY    8/2/2021 

ORCL      ORACLE CORP.      Money Wave Buy today, but ORCL will not be bought or logged as the Volume is below average of 12.3 MIL.

We will “Not Log” trades if the Reward/Risk is not at least 2:1, or Low Volume. These have more risk.   ____________________________________________________________________________________________________

JUMP START SCROLLING CHARTS: (Buy Signal should be very soon… Click on the Jump Start link for more info.)    

MMAT      META MATERIALS INC.    Buy above $4.24 with High Volume with a 5% Trailing Sell Stop Loss below it.     

NEGG      NEWEGG COMMERCE    Buy above the Pink Line around $22.96 with High Volume with a 5% Trailing Sell Stop Loss below it.     

____________________________________________________________________________________________________________

WATCH LIST

WATCH LIST SCROLLING CHARTS (Real Time)                

ALEC      ALECTOR INC.      Wait for Money Wave Close > 20 with High Volume.

AUUD      AUDDIA INC.     Buy above $3.56 with High Volume with a 5% Trailing Sell Stop Loss below it. 

LEDS      SEMILEDS CORP.   Buy above $10.11 with High Volume with a 5% Trailing Sell Stop Loss below it.

NURO      NEUROMETRIX INC.      Wait for Money Wave Close > 20 with High Volume.     

SAVA      CASSAVA SCIENCES INC.      Wait for Money Wave Close > 20 with High Volume.   

Please be patient and wait for Money Wave Buy Signals.  We will email you when they are ready. Follow on the WATCH LIST.      
Emotions are very high now, so please do not Buy unless you are VERY NIMBLE.

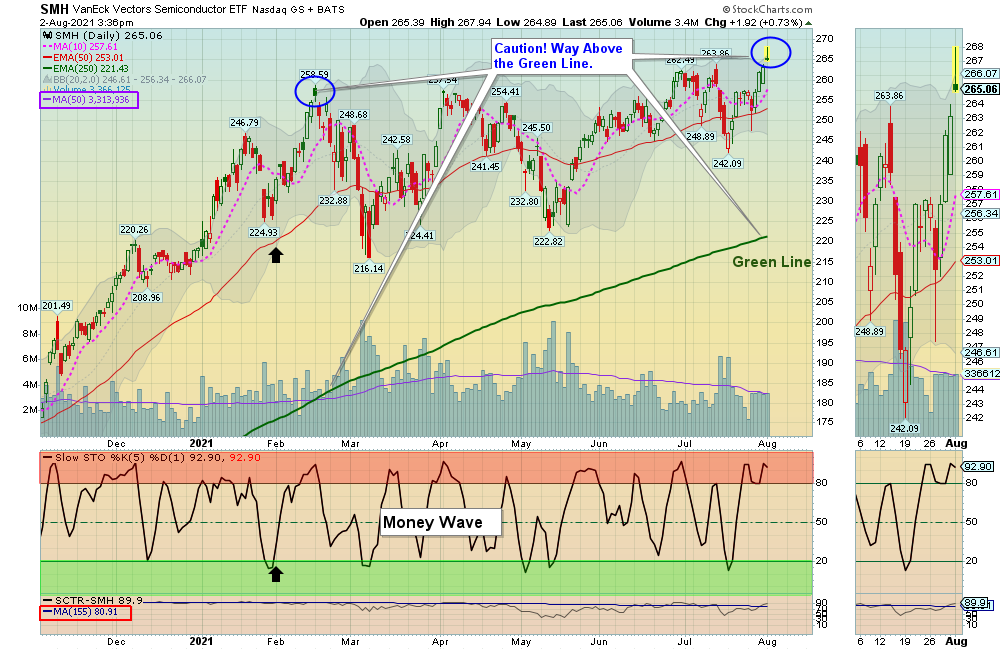
The Leaders are Way Above the Green Lines (all Investments eventually return to their Green Lines).      

____________________________________________________________________________________________________________

SELLS TODAY    

BLIN      BRIDGELINE SOFTWARE      Slipped below the Buy Price on the opening and was Stopped Out (Don’t Take a Loss!)  This trade was not logged.

QQQ      NASDAQ 100 FUND      EXIT if it is going to Close below the Pink Line around $364.72. The Target was already Hit.       

XLC      COMMUNICATIONS FUND      EXIT if it is going to Close below the Pink Line around $82.45.  The Target was already Hit.  This trade was not logged.

XRT      RETAIL FUND      EXIT if it is going to Close below the Pink Line around $95.63.  This trade was not logged.

Click for  CURRENT POSITION SCROLLING CHARTS – Real Time  (Please check and adjust your Sell Stops).     

Click for  CLOSED POSITIONS,   
NEW:       MY TRADING DASHBOARD
DAY TRADING SETUPS
NEW:  TRADE ALERTS
ARE YOUR INVESTMENTS ABOVE THE GREEN LINE?
ETF SECTOR ROTATION SYSTEM   
TOP 100 LIST Updated Aug 1, 2021

Many like to Buy the day before, near the Close, if the Money Wave is going to create a Buy Signal (Closing > 20 and out of the Green Zone).

Don’t Buy if the Investment has already popped up too much. Money Wave Buys are usually good for a 3-6 %  move in a few days.

We will “Not Log” trades if the Reward/Risk is not at least 2:1, or Low Volume. These have more risk.   

Related Post

– Money Wave Alert! Jul 30, 2021

Subscribe to Our Newsletter

AGL Logo

Get our eBook Now!

Candlestick - A Swing Traders Friend

We don’t spam! Read our privacy policy for more info.

You’ve been successfully subscribed to our newsletter!

Voted #1 at Stock Charts

SH Chart
Inverse S&P 500 Fund (SH) will have a Money Wave Buy today.

Help Us Help Animals

Help Us Help Animals

Recent Comments

  • Market Breadth Indicators: A Trader’s Guide to Early Trend Detection on Backtesting: Definition and How a Trading Strategy Backtest Works
  • Island Reversal Pattern: Definition and Formation Explained on Double Top Pattern: How to Identify and Trade This Reversal Signal
  • Channel Pattern Guide: What It Is and Why It Matters on A Guide to Forecasting Using Moving Averages
  • What Is a Broadening Bottom Chart Pattern? Full Guide on Bull vs. Bear Market: An Investor’s Guide to Market Phases
  • ATGL Weekly Money Flow - 2025-05-11 on ATGL Top Pick of the Week! Apr 6, 2025

Become a Green Liner!

Help me make more Money in the Stock Market.

ON ATGL

  • DashBoard
  • Weekly Commentary
  • Daily Buy / Sell Signals
  • Day Trade Setup
  • Trading Rooms

Design & Develop By Pixelvect

STRATEGIES

  • Swing Trading
  • ATGL Pick of the Week
  • Dividend Growth
  • ETF Sector Rotation
  • Dogs of the Dow

HELP

  • ATGL Trading Rules
  • FAQ
  • Account Maintenance
  • Contact US
  • Join

FOLLOW US

Instagram Linkedin Twitter Facebook

© COPYRIGHT 2024 · ABOVETHEGREENLINE.COM · ALL RIGHTS RESERVED · PRIVACY · TERMS · CONTACT · WATCHLIST · CURRENT