Above the Green Line -01
  • Market Insights
        • Commentary
          • Daily
          • Weekly
        • BUY / SELL SIGNALS
          • Trade Posts
          • Recent Trade Alerts
          • Recent Day Trades
        • BLOGROLL
          • Dividend Growth Blog
          • ETF Sector Blog
          • Dow Dogs
          • TPOW Blog
  • Strategies
        • SWING TRADING
          • Current Positions
          • Watchlists
          • Closed Positions
          • Candidates - TOP 100
          • Specialty Stocks
        • WEEKLY STOCK PICK
          • TPOW Charts
          • TPOW Performance
          • TPOW Strategy Guide
          • TPOW Performance Dashboard
        • DAY TRADING
          • Watch List
        • ATGL DASHBOARD
        • ETF STRATEGIES
          • ETF Sector Rotation
          • ETF Sector Portfolio
        • DIVIDEND GROWTH
          • Dividend Growth Portfolio
          • Dividend Calendar
        • DOGS OF THE DOW
          • Dogs of the Dow Portfolio
          • DOW 5 Portfolio
  • Markets
        • US MARKET
          • Commodities
          • Energy
          • Precious Metals
          • Volatility
        • GLOBAL MARKETS
          • Market Indices
          • Economic Calendar
          • FOREX Heat Map
          • FOREX Cross Rates
          • Crypto Currency Market
  • Investing
    • Discord Community
    • Dashboard
  • Resources
        • ARTICLES
          • Dividend Growth Model Articles
          • ETF Articles
          • Investment Strategies Articles
          • Market and Economic Insights
          • Stock Trade Articles
          • Stock Reviews
        • TOOLS
          • Stock Scanners
          • Charting Software
          • Brokerage Firms
        • STOCK CHARTS
          • Key Components
          • Reading Charts
          • Drawing Stock Charts
          • Identifying Trends
        • RETIREMENT PLANNING
  • About
    • Contact Us
    • How to Win
    • #1 At Stockcharts
    • Disclaimer
    • FAQ
  • Log In
  • Subscribe

July 27, 2021

Money Wave Alert! Jul 27, 2021

QQQ Chart
Profit taking today on the NASDAQ 100 Fund (QQQ).

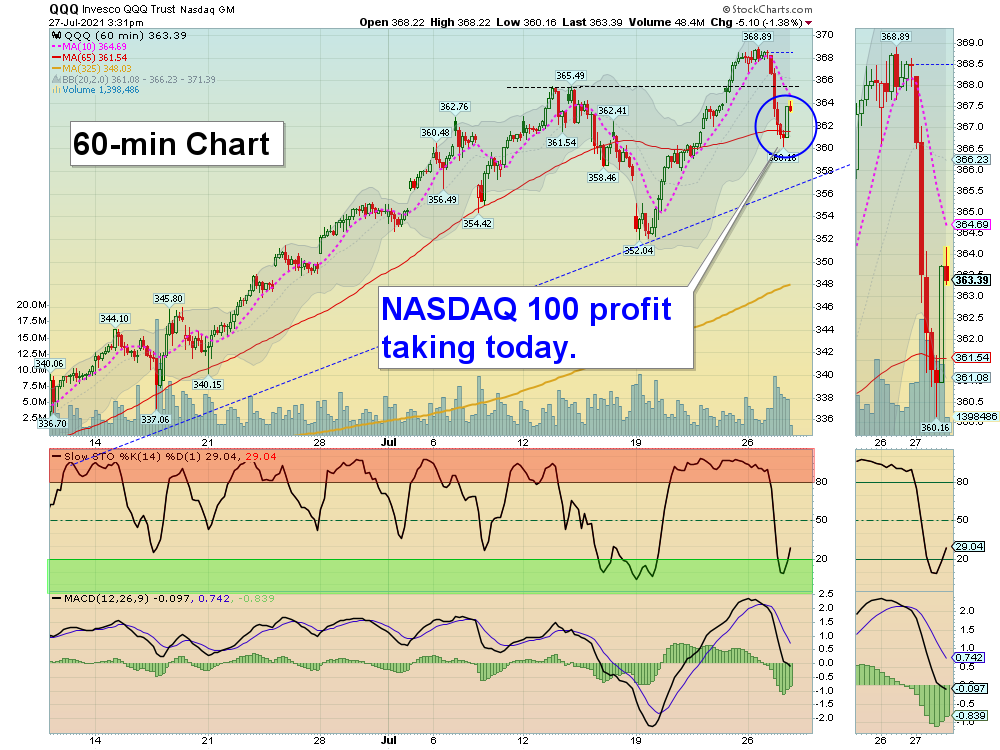
Markets were lower today as the Large Tech Stocks finally had some mild profit taking. The leading S&P 500, DOW 30, and NASDAQ 100 Indices went down near their Pink Lines (10-day avgs.) and bounced back up some to avoid Short Term Sell Signals. Now we will see if the Indices can make more Highs on the bounce, or stall out.

Earnings will be out after the Close today on Alphabet (Google), Apple, and Microsoft.

The Markets are on Highs, but the Buying is not broad based. Investor’s Greed has caused FOMO (FEAR OF MISSING OUT), so many emotional Investors have piled in up here because they don’t have the patience to WAIT for a pull-back. 

NEW SUBSCRIBERS:  Many Leaders are quickly back up in the Red Zones (probably too late to Buy for the Short Term). But several strong Stocks on the WatchList below have pulled back 30-50%, and should have nice bounces back up soon. Most of the Buying last week was the very Largest Stocks, of which most had lower Relative Strength.  The better trades happen when the S&P 500 Index is also in the Green Zone (now back up in the Red Zone again). 

One nice pop today on XELA on DAY TRADING SETUPS

Bonds  were up today, but are back above the Green Line.

Crude Oil was down $0.323 today at $71.59. 

BUYS TODAY    7/27/2021   NONE TODAY

_______________________________________________________________________________________________________

JUMP START SCROLLING CHARTS: (Buy Signal should be very soon… Click on the Jump Start link for more info.)    

MMAT      META MATERIALS INC.    Buy above $4.24 with High Volume with a 5% Trailing Sell Stop Loss below it.     

____________________________________________________________________________________________________________

WATCH LIST

WATCH LIST SCROLLING CHARTS (Real Time)                

AUUD      AUDDIA INC.    Buy above $4.03 with High Volume with a 5% Trailing Sell Stop Loss below it.   

BB      BLACKBERRY LTD.     Buy above $10.90 with High Volume with a 5% Trailing Sell Stop Loss below it.       

LEDS      SEMILEDS CORP.   Buy above the Pink Line around $9.78 with High Volume with a 5% Trailing Sell Stop Loss below it.

MRIN      MARIN SOFTWARE INC.      Buy above the Pink Line around $8.84 with High Volume with a 5% Trailing Sell Stop Loss below it.

NEGG      NEWEGG COMMERCE    Buy above the Pink Line around $26.48 with High Volume with a 5% Trailing Sell Stop Loss below it.

Please be patient and wait for Money Wave Buy Signals.  We will email you when they are ready. Follow on the WATCH LIST.      XRT      RETAIL FUND
Emotions are very high now, so please do not Buy unless you are VERY NIMBLE.

The Leaders are Way Above the Green Lines (all Investments eventually return to their Green Lines).      

____________________________________________________________________________________________________________

SELLS TODAY    

XRT      RETAIL FUND      EXIT if it is going to Close below the Pink Line around $94.62. This trade was not logged.

Click for  CURRENT POSITION SCROLLING CHARTS – Real Time  (Please check and adjust your Sell Stops).        
Click for  CLOSED POSITIONS,   
NEW:       MY TRADING DASHBOARD
DAY TRADING SETUPS
NEW:  TRADE ALERTS
ARE YOUR INVESTMENTS ABOVE THE GREEN LINE?
ETF SECTOR ROTATION SYSTEM   
TOP 100 LIST Updated Jul 5, 2021

Many like to Buy the day before, near the Close, if the Money Wave is going to create a Buy Signal (Closing > 20 and out of the Green Zone).

Don’t Buy if the Investment has already popped up too much. Money Wave Buys are usually good for a 3-6 %  move in a few days.

We will “Not Log” trades if the Reward/Risk is not at least 2:1, or Low Volume. These have more risk.     

Related Post

– Money Wave Alert! Jul 26, 2021

Subscribe to Our Newsletter

AGL Logo

Get our eBook Now!

Candlestick - A Swing Traders Friend

We don’t spam! Read our privacy policy for more info.

You’ve been successfully subscribed to our newsletter!

Voted #1 at Stock Charts

SH Chart
Inverse S&P 500 Fund (SH) will have a Money Wave Buy today.

Help Us Help Animals

Help Us Help Animals

Recent Comments

  • Market Breadth Indicators: A Trader’s Guide to Early Trend Detection on Backtesting: Definition and How a Trading Strategy Backtest Works
  • Island Reversal Pattern: Definition and Formation Explained on Double Top Pattern: How to Identify and Trade This Reversal Signal
  • Channel Pattern Guide: What It Is and Why It Matters on A Guide to Forecasting Using Moving Averages
  • What Is a Broadening Bottom Chart Pattern? Full Guide on Bull vs. Bear Market: An Investor’s Guide to Market Phases
  • ATGL Weekly Money Flow - 2025-05-11 on ATGL Top Pick of the Week! Apr 6, 2025

Become a Green Liner!

Help me make more Money in the Stock Market.

ON ATGL

  • DashBoard
  • Weekly Commentary
  • Daily Buy / Sell Signals
  • Day Trade Setup
  • Trading Rooms

Design & Develop By Pixelvect

STRATEGIES

  • Swing Trading
  • ATGL Pick of the Week
  • Dividend Growth
  • ETF Sector Rotation
  • Dogs of the Dow

HELP

  • ATGL Trading Rules
  • FAQ
  • Account Maintenance
  • Contact US
  • Join

FOLLOW US

Instagram Linkedin Twitter Facebook

© COPYRIGHT 2024 · ABOVETHEGREENLINE.COM · ALL RIGHTS RESERVED · PRIVACY · TERMS · CONTACT · WATCHLIST · CURRENT