Above the Green Line -01
  • Market Insights
        • Commentary
          • Daily
          • Weekly
        • BUY / SELL SIGNALS
          • Trade Posts
          • Recent Trade Alerts
          • Recent Day Trades
        • BLOGROLL
          • Dividend Growth Blog
          • ETF Sector Blog
          • Dow Dogs
          • TPOW Blog
  • Strategies
        • SWING TRADING
          • Current Positions
          • Watchlists
          • Closed Positions
          • Candidates - TOP 100
          • Specialty Stocks
        • WEEKLY STOCK PICK
          • TPOW Charts
          • TPOW Performance
          • TPOW Strategy Guide
          • TPOW Performance Dashboard
        • DAY TRADING
          • Watch List
        • ATGL DASHBOARD
        • ETF STRATEGIES
          • ETF Sector Rotation
          • ETF Sector Portfolio
        • DIVIDEND GROWTH
          • Dividend Growth Portfolio
          • Dividend Calendar
        • DOGS OF THE DOW
          • Dogs of the Dow Portfolio
          • DOW 5 Portfolio
  • Markets
        • US MARKET
          • Commodities
          • Energy
          • Precious Metals
          • Volatility
        • GLOBAL MARKETS
          • Market Indices
          • Economic Calendar
          • FOREX Heat Map
          • FOREX Cross Rates
          • Crypto Currency Market
  • Investing
    • Discord Community
    • Dashboard
  • Resources
        • ARTICLES
          • Dividend Growth Model Articles
          • ETF Articles
          • Investment Strategies Articles
          • Market and Economic Insights
          • Stock Trade Articles
          • Stock Reviews
        • TOOLS
          • Stock Scanners
          • Charting Software
          • Brokerage Firms
        • STOCK CHARTS
          • Key Components
          • Reading Charts
          • Drawing Stock Charts
          • Identifying Trends
        • RETIREMENT PLANNING
  • About
    • Contact Us
    • How to Win
    • #1 At Stockcharts
    • Disclaimer
    • FAQ
  • Log In
  • Subscribe

July 14, 2021

Money Wave Alert! Jul 14, 2021

QQQ Chart
The top 10 NASDAQ 100 Stocks account for 54% of the Value of the Index.

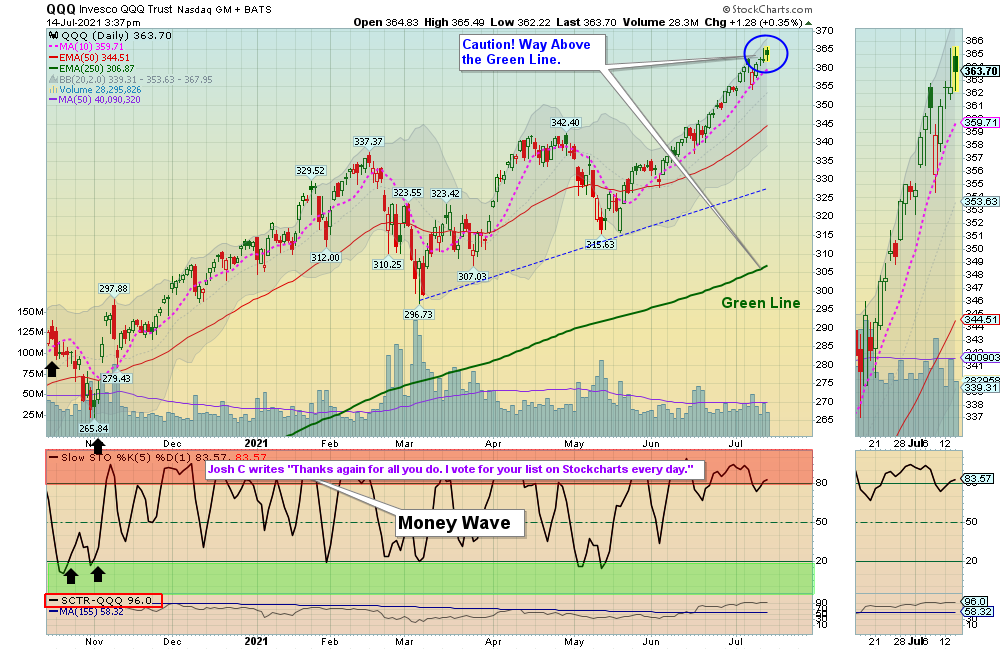
Markets were slightly higher today on low Volume Buying. The NASDAQ 100 Index was able to make New Highs on Big Tech Buying. Currently the 10 largest Stocks in the NASDAQ 100 account for 54% of the total Value of the Index (not just 10 %).  This is hiding the distribution (or Selling) going on by Smart Money (Way Above the Green Line). The Small Cap Index failed at the 50-day average. Quarterly Earnings are starting to come out. 

The Indices are stretched Way Above the Green Lines as novice Investors continue to Buy on FOMO (Fear of Missing Out). The Indices are being held up with Buying of the very largest Companies. 

NEW SUBSCRIBERS:  Markets are Way Above the Green Lines and Buying has weakened for many stocks. That is when new investors LOSE Money. Please WAIT for the Volume to improve. The low Volume recently has WARNED us against Buying much at this time. The better trades happen when the S&P 500 Index is also in the Green Zone. 

Waiting for pops soon on DAY TRADING SETUPS

Bonds  were lower today, and are back below the Green Line.

Crude Oil was down. $2.53 today at $72.74. 

BUYS TODAY    7/14/2021   NONE TODAY

_______________________________________________________________________________________________________

JUMP START SCROLLING CHARTS: (Buy Signal should be very soon… Click on the Jump Start link for more info.)       

BB      BLACKBERRY LTD.     Buy above the Pink Line around $11.62 with High Volume with a 5% Trailing Sell Stop Loss below it.      

MRIN      MARIN SOFTWARE INC.      Wait for Money Wave Close > 20 with High Volume.     

____________________________________________________________________________________________________________

WATCH LIST

WATCH LIST SCROLLING CHARTS (Real Time)                

AMC      AMC ENTERTAINMENT      Wait for Money Wave Close > 20 with High Volume.     

AUUD      AUDDIA INC.      Wait for Money Wave Close > 20 with High Volume.     

BLIN      BRIDGELINE SOFTWARE       Wait for Money Wave Close > 20 with High Volume.

MMAT      META MATERIALS INC.    Buy above the Pink Line around $5.72 with High Volume with a 5% Trailing Sell Stop Loss below it.     

MVIS      MICROVISION INC.      Buy above the Pink Line around $15.56 with High Volume with a 5% Trailing Sell Stop Loss below it.      

Please be patient and wait for Money Wave Buy Signals.  We will email you when they are ready. Follow on the WATCH LIST.
Emotions are very high now, so please do not Buy unless you are VERY NIMBLE.

The Leaders are Way Above the Green Lines (all Investments eventually return to their Green Lines).      

____________________________________________________________________________________________________________

SELLS TODAY    NONE TODAY      

Click for  CURRENT POSITION CHARTS – Real Time  (Please check and adjust your Sell Stops).        
Click for  CLOSED POSITIONS,   
NEW:       MY TRADING DASHBOARDDAY TRADING SETUPS
NEW:  TRADE ALERTS
ARE YOUR INVESTMENTS ABOVE THE GREEN LINE?
ETF SECTOR ROTATION SYSTEM   
TOP 100 LIST Updated Jul 5, 2021

Many like to Buy the day before, near the Close, if the Money Wave is going to create a Buy Signal (Closing > 20 and out of the Green Zone).

Don’t Buy if the Investment has already popped up too much. Money Wave Buys are usually good for a 3-6 %  move in a few days.

We will “Not Log” trades if the Reward/Risk is not at least 2:1, or Low Volume. These have more risk.     

Related Post

– Money Wave Alert! Jul 13, 2021

Subscribe to Our Newsletter

AGL Logo

Get our eBook Now!

Candlestick - A Swing Traders Friend

We don’t spam! Read our privacy policy for more info.

You’ve been successfully subscribed to our newsletter!

Voted #1 at Stock Charts

SH Chart
Inverse S&P 500 Fund (SH) will have a Money Wave Buy today.

Help Us Help Animals

Help Us Help Animals

Recent Comments

  • Market Breadth Indicators: A Trader’s Guide to Early Trend Detection on Backtesting: Definition and How a Trading Strategy Backtest Works
  • Island Reversal Pattern: Definition and Formation Explained on Double Top Pattern: How to Identify and Trade This Reversal Signal
  • Channel Pattern Guide: What It Is and Why It Matters on A Guide to Forecasting Using Moving Averages
  • What Is a Broadening Bottom Chart Pattern? Full Guide on Bull vs. Bear Market: An Investor’s Guide to Market Phases
  • ATGL Weekly Money Flow - 2025-05-11 on ATGL Top Pick of the Week! Apr 6, 2025

Become a Green Liner!

Help me make more Money in the Stock Market.

ON ATGL

  • DashBoard
  • Weekly Commentary
  • Daily Buy / Sell Signals
  • Day Trade Setup
  • Trading Rooms

Design & Develop By Pixelvect

STRATEGIES

  • Swing Trading
  • ATGL Pick of the Week
  • Dividend Growth
  • ETF Sector Rotation
  • Dogs of the Dow

HELP

  • ATGL Trading Rules
  • FAQ
  • Account Maintenance
  • Contact US
  • Join

FOLLOW US

Instagram Linkedin Twitter Facebook

© COPYRIGHT 2024 · ABOVETHEGREENLINE.COM · ALL RIGHTS RESERVED · PRIVACY · TERMS · CONTACT · WATCHLIST · CURRENT