Above the Green Line -01
  • Market Insights
        • Commentary
          • Daily
          • Weekly
        • BUY / SELL SIGNALS
          • Trade Posts
          • Recent Trade Alerts
          • Recent Day Trades
        • BLOGROLL
          • Dividend Growth Blog
          • ETF Sector Blog
          • Dow Dogs
          • TPOW Blog
  • Strategies
        • SWING TRADING
          • Current Positions
          • Watchlists
          • Closed Positions
          • Candidates - TOP 100
          • Specialty Stocks
        • WEEKLY STOCK PICK
          • TPOW Charts
          • TPOW Performance
          • TPOW Strategy Guide
          • TPOW Performance Dashboard
        • DAY TRADING
          • Watch List
        • ATGL DASHBOARD
        • ETF STRATEGIES
          • ETF Sector Rotation
          • ETF Sector Portfolio
        • DIVIDEND GROWTH
          • Dividend Growth Portfolio
          • Dividend Calendar
        • DOGS OF THE DOW
          • Dogs of the Dow Portfolio
          • DOW 5 Portfolio
  • Markets
        • US MARKET
          • Commodities
          • Energy
          • Precious Metals
          • Volatility
        • GLOBAL MARKETS
          • Market Indices
          • Economic Calendar
          • FOREX Heat Map
          • FOREX Cross Rates
          • Crypto Currency Market
  • Investing
    • Discord Community
    • Dashboard
  • Resources
        • ARTICLES
          • Dividend Growth Model Articles
          • ETF Articles
          • Investment Strategies Articles
          • Market and Economic Insights
          • Stock Trade Articles
          • Stock Reviews
        • TOOLS
          • Stock Scanners
          • Charting Software
          • Brokerage Firms
        • STOCK CHARTS
          • Key Components
          • Reading Charts
          • Drawing Stock Charts
          • Identifying Trends
        • RETIREMENT PLANNING
  • About
    • Contact Us
    • How to Win
    • #1 At Stockcharts
    • Disclaimer
    • FAQ
  • Log In
  • Subscribe

April 9, 2017

Weekly Commentary Apr 9, 2017


SPY Chart
So Far, the Bounce off the Red Line is weak!


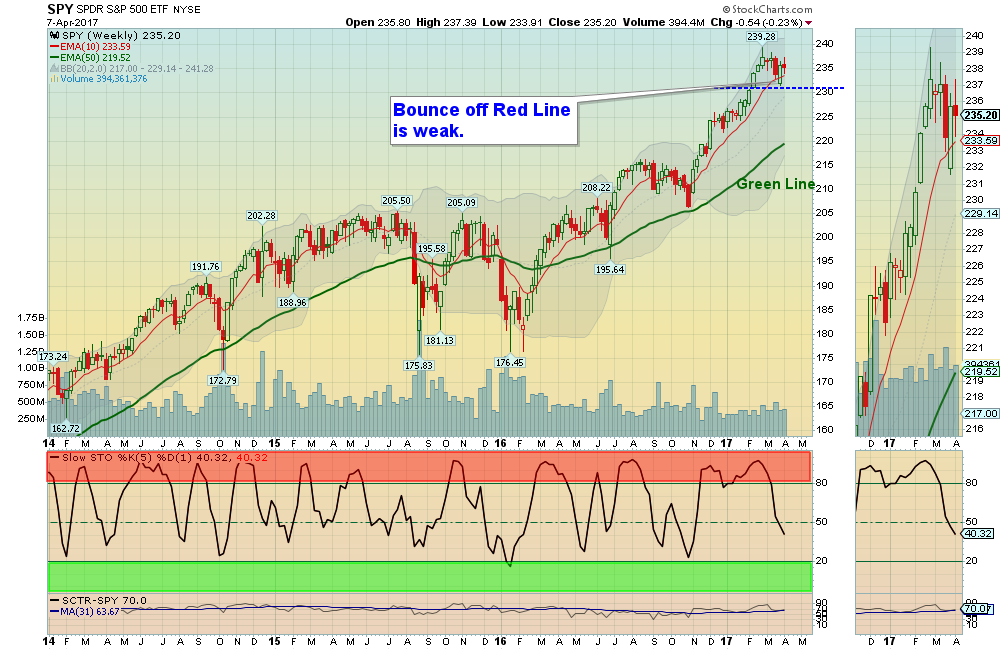
04/09/2017:  Markets were down slightly for the week, as the weekly bounce of the major Indices off of the Red Lines was not impressive. Usually the bounce would quickly go back up to the Highs, or higher… Falling below the Red Line would indicate that the Correction has arrived.

Bonds are back up near Resistance Support, so probably not much movement anywhere until the Economy shows more speed, or slows down…

Crude OIL was up 2% for the week,  but it needs to Close above $55.24 for a Bull to begin.


MONEY WAVE BUYS SOON:    There are 2 Open Positions,  and 10 Investments are on the Watch List.

ON DECK to Buy soon:  Watch List.

Wait for GREEN ZONE BUYS.  We will email or text when they are ready.  


LONG TERM TRADES – We are looking for a good Entry Point for these, which could possibly Double:

DBC   COMMODITY FUND   Waiting for Break Out Above $16.08.
IPI    INTREPID POTASH    Waiting for Break Out Above $3.04.
JJC     COPPER FUND            Waiting on a Pull-back.
KOL    COAL FUND         Waiting for a Pull-back.
MDR    MCDERMOTT INT’L.  Waiting for Bounce Up & Above 90 Relative Strength.
UGA   US GASOLINE FUND   Waiting on Break Out Above $32.03.

Click for  Portfolio (Open Positions)  
Click for  Watch List
Click for  Closed Positions

Alert! Market Risk (Yellow Zone). The probability of successful Short Term Trades is lower, when the S&P 500 is Way Above the Green Line. Even the Strongest Funds can get chopped up. Either take quick gains from Money Wave Pops, or STAY IN CASH & WAIT for a larger correction.

[s_static_display]

Tell your Friend about us, and HELP ANIMALS.


Question: Mike asks “When you say “you will not log the trade” what does that mean?

Thanks…”

ANSWER: Hi Mike, if the Reward / Risk is not 2:1 of better we will not log the trade (or count it in our Performance Record).

Some members want to see every mechanical Money Wave Buy Signal,  but the Money Wave pops are usually only good for 3-5 % in the Short Term.

If a stock is already up >3%, we will normally not log the trade.  Good trading, and tell your friends!


Related Post

– Weekly Commentary for Apr 1, 2017

Subscribe to Our Newsletter

AGL Logo

Get our eBook Now!

Candlestick - A Swing Traders Friend

We don’t spam! Read our privacy policy for more info.

You’ve been successfully subscribed to our newsletter!

Voted #1 at Stock Charts

SH Chart
Inverse S&P 500 Fund (SH) will have a Money Wave Buy today.

Help Us Help Animals

Help Us Help Animals

Recent Comments

  • Market Breadth Indicators: A Trader’s Guide to Early Trend Detection on Backtesting: Definition and How a Trading Strategy Backtest Works
  • Island Reversal Pattern: Definition and Formation Explained on Double Top Pattern: How to Identify and Trade This Reversal Signal
  • Channel Pattern Guide: What It Is and Why It Matters on A Guide to Forecasting Using Moving Averages
  • What Is a Broadening Bottom Chart Pattern? Full Guide on Bull vs. Bear Market: An Investor’s Guide to Market Phases
  • ATGL Weekly Money Flow - 2025-05-11 on ATGL Top Pick of the Week! Apr 6, 2025

Become a Green Liner!

Help me make more Money in the Stock Market.

ON ATGL

  • DashBoard
  • Weekly Commentary
  • Daily Buy / Sell Signals
  • Day Trade Setup
  • Trading Rooms

Design & Develop By Pixelvect

STRATEGIES

  • Swing Trading
  • ATGL Pick of the Week
  • Dividend Growth
  • ETF Sector Rotation
  • Dogs of the Dow

HELP

  • ATGL Trading Rules
  • FAQ
  • Account Maintenance
  • Contact US
  • Join

FOLLOW US

Instagram Linkedin Twitter Facebook

© COPYRIGHT 2024 · ABOVETHEGREENLINE.COM · ALL RIGHTS RESERVED · PRIVACY · TERMS · CONTACT · WATCHLIST · CURRENT