Above the Green Line -01
  • Market Insights
        • Commentary
          • Daily
          • Weekly
        • BUY / SELL SIGNALS
          • Trade Posts
          • Recent Trade Alerts
          • Recent Day Trades
        • BLOGROLL
          • Dividend Growth Blog
          • ETF Sector Blog
          • Dow Dogs
          • TPOW Blog
  • Strategies
        • SWING TRADING
          • Current Positions
          • Watchlists
          • Closed Positions
          • Candidates - TOP 100
          • Specialty Stocks
        • WEEKLY STOCK PICK
          • TPOW Charts
          • TPOW Performance
          • TPOW Strategy Guide
          • TPOW Performance Dashboard
        • DAY TRADING
          • Watch List
        • ATGL DASHBOARD
        • ETF STRATEGIES
          • ETF Sector Rotation
          • ETF Sector Portfolio
        • DIVIDEND GROWTH
          • Dividend Growth Portfolio
          • Dividend Calendar
        • DOGS OF THE DOW
          • Dogs of the Dow Portfolio
          • DOW 5 Portfolio
  • Markets
        • US MARKET
          • Commodities
          • Energy
          • Precious Metals
          • Volatility
        • GLOBAL MARKETS
          • Market Indices
          • Economic Calendar
          • FOREX Heat Map
          • FOREX Cross Rates
          • Crypto Currency Market
  • Investing
    • Discord Community
    • Dashboard
  • Resources
        • ARTICLES
          • Dividend Growth Model Articles
          • ETF Articles
          • Investment Strategies Articles
          • Market and Economic Insights
          • Stock Trade Articles
          • Stock Reviews
        • TOOLS
          • Stock Scanners
          • Charting Software
          • Brokerage Firms
        • STOCK CHARTS
          • Key Components
          • Reading Charts
          • Drawing Stock Charts
          • Identifying Trends
        • RETIREMENT PLANNING
  • About
    • Contact Us
    • How to Win
    • #1 At Stockcharts
    • Disclaimer
    • FAQ
  • Log In
  • Subscribe

September 1, 2020

Money Wave Alert! Sep 1, 2020

ZM Chart
Zoom Video (ZM) gapped up 40% today on great Earnings.

Markets were higher today, as the Techs moved up and nobody has a reason to Sell. The Markets are very complacent up here, which normally means a pull-back is coming.

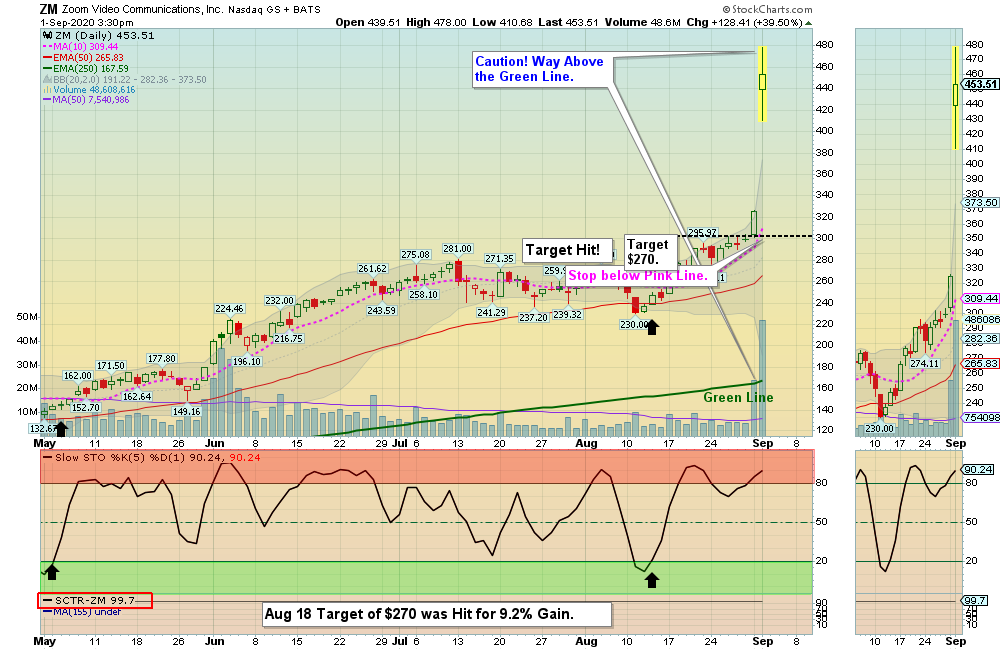
The S&P 500 Index is walking up the Pink Line (10-day avg) and closing below 3452 should create a Short Term Sell Signal. This move up from the March Lows is sucking in all of the undisciplined emotional Buyer’s Money. They never seem to learn from History. The Markets are stretched Way Above the Green Line, and will eventually snap back down to Flush Tammy out again.

It could be bearish if the S&P 500 falls below Support of 3393 because most of the recent advance S&P 500 has been 15 of the Largest Caps. 

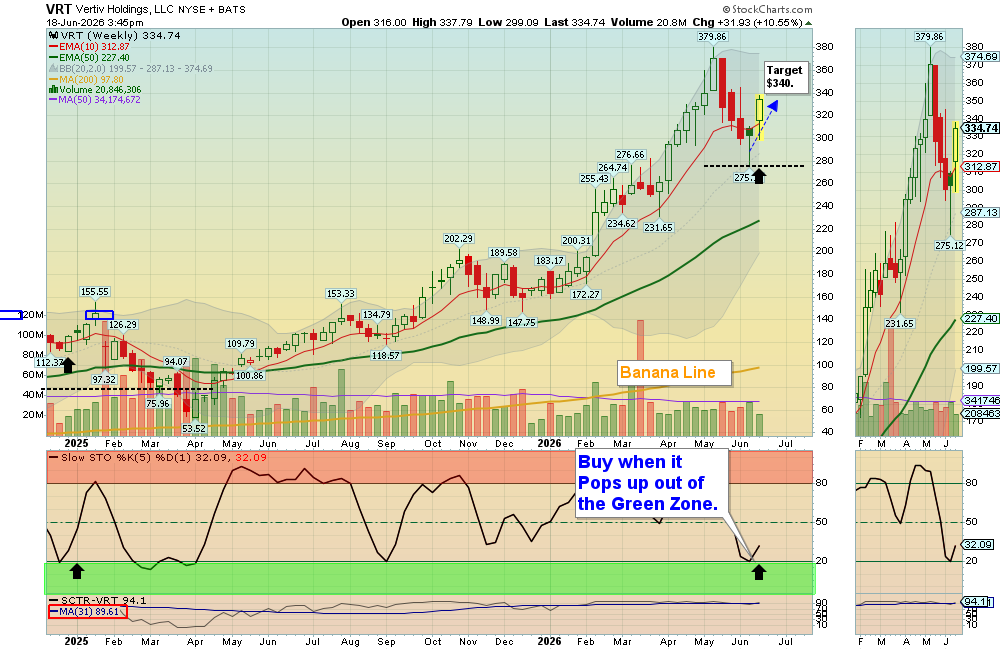
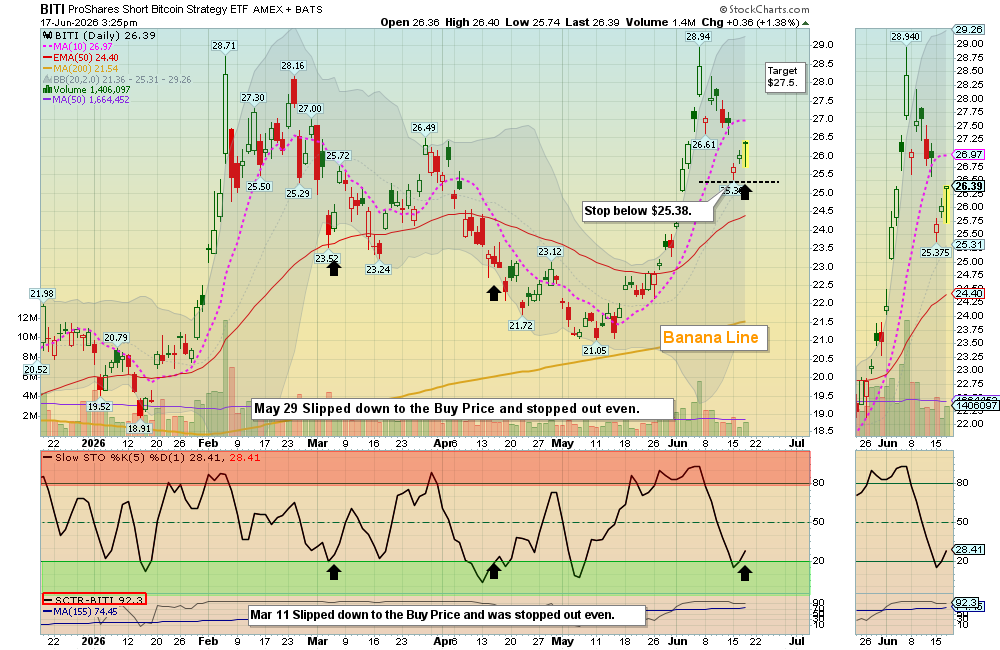
Please WAIT for the Leaders below to pop up out of the Green Zones for Money Wave Buy Signals. The better trades happen when the S&P 500 Index is also in the Green Zone. (Now the S&P 500 is back up in the Red Zone).

Please remember that the Markets are up 58 % from the March Lows, and are over-bought from extreme Confidence and Hope. 

Bonds  were up again today. 

Crude Oil was up $0.14 today at $42.75.

BUYS TODAY    9/1/2020   

WTRH      WAITR HOLDINGS      Bought above $4.15 with a 5% Trailing Sell Stop Loss below it. Target is $5.25.  EXIT below $4.02.


ETSY      ETSY INC.        Money Wave Buy today.  ETSY will not be logged as the Volume is below average of 3.5 MIL.

GSX      GSX TECHEDU INC.       Bought above $91.75 today with a 3% Trailing Sell Stop (now at $92.59). GSX will not be logged as it is already up 10% today.

KODK      EASTMAN KODAK CO.      KODK Gapped UP 58% on the opening, so it will not be logged. 

We will “Not Log” trades if the Reward/Risk is not at least 2:1.     

JUMP START: (Buy Signal should be very soon… Click on the Jump Start link for more info.)  

OSTK     OVERSTOCK.COM INC.

MAXR      MAXAR TECHNOLOGIES     

W       WAYFAIR INC.

____________________________________________________________________________________________________________________________________________________  

WATCH LIST

Money Wave Buys Signals Soon (3 Days-3 Weeks Short Term):   (Best to Buy these when the S&P 500 is also in the Green Zone.)       

The Following Investments will probably have a Money Wave Buy Signal soon. (Slow Stochastic Closing > 20) on today’s Close.      

ADT       ADT INC.      Buy above the Pink Line of $11.19 with a 5% Trailing Sell Stop Loss below it.  

FLDM      FLUIDIGM CORP.

VXRT     VAXART INC.     2nd Money Wave Buy soon     

Please be patient and wait for Money Wave Buy Signals.  We will email you when they are ready. Follow on the WATCH LIST.

Emotions are very high now, so please do not Buy unless you are VERY NIMBLE.

The Leaders are Way Above the Green Lines (all Investments eventually return to their Green Lines).

___________________________________________________________________________________________________

SELLS TODAY   

APPS       DIGITAL TURBINE INC.      EXIT if you can Sell above $27.50 for a 13.7% Gain.     

GDX      GOLD MINERS FUND       EXIT if it is going to Close below your Buy Price, or $41.60.      

SRNE      SORRENTO THERA.      LOWER the Sell Stop Loss below the Green Line of $5.16 until it bottoms. Relative Strength is still 97.


DOCU      DOCUSIGN INC.     Target of $225 was Hit for a 20.5% Gain.  This trade was not logged.

PINS      PINTEREST INC.      Target of $37 was Hit for a 7.8% Gain.  This trade was not logged.     

SPOT      SPOTIFY INC.      Target of $290 was Hit for a 13.6% Gain.  This trade was not logged.

Click for  CURRENT POSITIONS  and adjust your Sell Stops.   
Click for  CLOSED POSITIONS,   

NEW PENNY STOCK WATCH LIST
ARE YOUR INVESTMENTS ABOVE THE GREEN LINE?
ETF SECTOR ROTATION SYSTEM   
NEW TOP 100 LIST Updated Aug 4, 2020

Many like to Buy the day before, near the Close, if the Money Wave is going to create a Buy Signal (Closing > 20 and out of the Green Zone).

Don’t Buy if the Investment has already popped up too much. Money Wave Buys are usually good for a 3-6 %  move in a few days.

We will “Not Log” trades if the Reward/Risk is not at least 2:1.     

Related Post

– Money Wave Alert! Aug 31, 2020

Subscribe to Our Newsletter

AGL Logo

Get our eBook Now!

Candlestick - A Swing Traders Friend

We don’t spam! Read our privacy policy for more info.

You’ve been successfully subscribed to our newsletter!

Voted #1 at Stock Charts

SH Chart
Inverse S&P 500 Fund (SH) will have a Money Wave Buy today.

Help Us Help Animals

Help Us Help Animals

Recent Comments

  • Market Breadth Indicators: A Trader’s Guide to Early Trend Detection on Backtesting: Definition and How a Trading Strategy Backtest Works
  • Island Reversal Pattern: Definition and Formation Explained on Double Top Pattern: How to Identify and Trade This Reversal Signal
  • Channel Pattern Guide: What It Is and Why It Matters on A Guide to Forecasting Using Moving Averages
  • What Is a Broadening Bottom Chart Pattern? Full Guide on Bull vs. Bear Market: An Investor’s Guide to Market Phases
  • ATGL Weekly Money Flow - 2025-05-11 on ATGL Top Pick of the Week! Apr 6, 2025

Become a Green Liner!

Help me make more Money in the Stock Market.

ON ATGL

  • DashBoard
  • Weekly Commentary
  • Daily Buy / Sell Signals
  • Day Trade Setup
  • Trading Rooms

Design & Develop By Pixelvect

STRATEGIES

  • Swing Trading
  • ATGL Pick of the Week
  • Dividend Growth
  • ETF Sector Rotation
  • Dogs of the Dow

HELP

  • ATGL Trading Rules
  • FAQ
  • Account Maintenance
  • Contact US
  • Join

FOLLOW US

Instagram Linkedin Twitter Facebook

© COPYRIGHT 2024 · ABOVETHEGREENLINE.COM · ALL RIGHTS RESERVED · PRIVACY · TERMS · CONTACT · WATCHLIST · CURRENT