
Average True Range (ATR)
The Average True Range (ATR) is a technical indicator used in Technical Analysis to measure stock market volatility. Developed by Welles Wilder Jr, the ATR is determined by decomposing the entire range of a security price for a specific period.
KEY TAKEAWAYS
- Average true range (ATR) is a technical indicator measuring market volatility.
- It is typically derived from the 14-day moving average of a series of true range indicators.
- It was originally developed for use in commodities markets but has since been applied to all types of securities.
The formula for calculating the ATR is give by the expression:
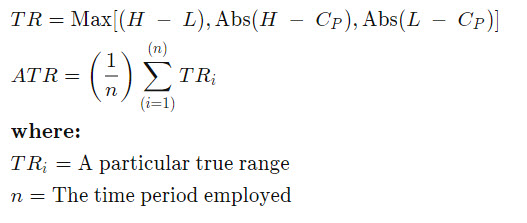
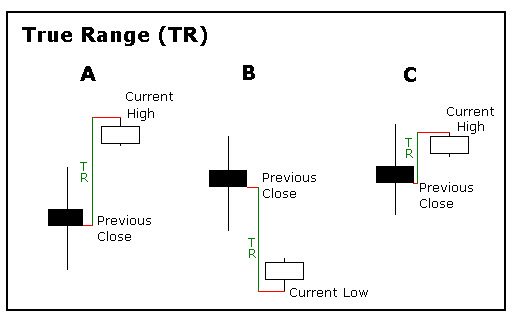
Initially Wilder explored the True Range (TR) because of its simplicity which is illustrated below.
Final Comments
Originally developed for commodities, the indicator can also be used for stocks and indices. Simply put, a stock experiencing a high level of volatility has a higher ATR, and a low volatility stock has a lower ATR. The ATR may be used by market technicians to enter and exit trades, and it is a useful tool to add to a trading system. It was created to allow traders to more accurately measure the daily volatility of an asset by using simple calculations. The indicator does not indicate the price direction like the MACD or RSI; rather it is used primarily to measure volatility caused by gaps and limit up or down moves. The ATR is fairly simple to calculate and only needs historical price data.