Above the Green Line -01
  • Market Insights
        • Commentary
          • Daily
          • Weekly
        • BUY / SELL SIGNALS
          • Trade Posts
          • Recent Trade Alerts
          • Recent Day Trades
        • BLOGROLL
          • Dividend Growth Blog
          • ETF Sector Blog
          • Dow Dogs
          • TPOW Blog
  • Strategies
        • SWING TRADING
          • Current Positions
          • Watchlists
          • Closed Positions
          • Candidates - TOP 100
          • Specialty Stocks
        • WEEKLY STOCK PICK
          • TPOW Charts
          • TPOW Performance
          • TPOW Strategy Guide
          • TPOW Performance Dashboard
        • DAY TRADING
          • Watch List
        • ATGL DASHBOARD
        • ETF STRATEGIES
          • ETF Sector Rotation
          • ETF Sector Portfolio
        • DIVIDEND GROWTH
          • Dividend Growth Portfolio
          • Dividend Calendar
        • DOGS OF THE DOW
          • Dogs of the Dow Portfolio
          • DOW 5 Portfolio
  • Markets
        • US MARKET
          • Commodities
          • Energy
          • Precious Metals
          • Volatility
        • GLOBAL MARKETS
          • Market Indices
          • Economic Calendar
          • FOREX Heat Map
          • FOREX Cross Rates
          • Crypto Currency Market
  • Investing
    • Discord Community
    • Dashboard
  • Resources
        • ARTICLES
          • Dividend Growth Model Articles
          • ETF Articles
          • Investment Strategies Articles
          • Market and Economic Insights
          • Stock Trade Articles
          • Stock Reviews
        • TOOLS
          • Stock Scanners
          • Charting Software
          • Brokerage Firms
        • STOCK CHARTS
          • Key Components
          • Reading Charts
          • Drawing Stock Charts
          • Identifying Trends
        • RETIREMENT PLANNING
  • About
    • Contact Us
    • How to Win
    • #1 At Stockcharts
    • Disclaimer
    • FAQ
  • Log In
  • Subscribe

May 1, 2020

Money Wave Alert! May 1, 2020

DIA Chart
The weaker DOW 30 Index is struggling Below the Green Line.


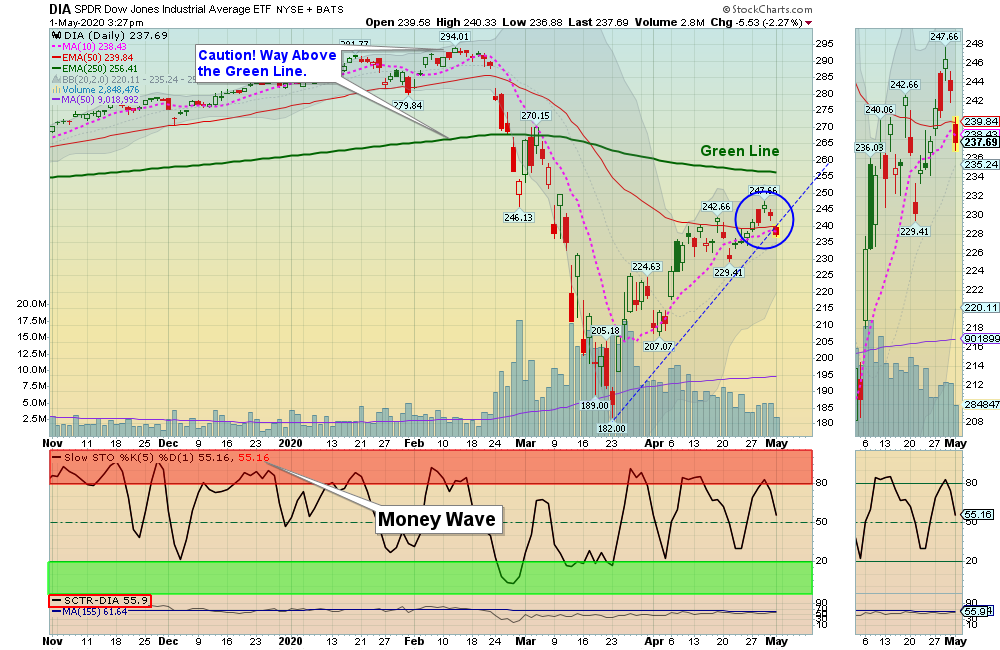
Markets were lower again today as more selling came in with most of the Indices Below the Green Lines. Many Leaders are quickly back down in the Green Zones for Money Wave Buy Signals soon. The Watch List below has grown, so probably a bounce soon for the Leaders.

The S&P 500 is at the 62% Retracement Level of the decline since the January Highs. Historically that Level could be the Top of a weak Market. We will see if the Markets roll over soon, or not. 

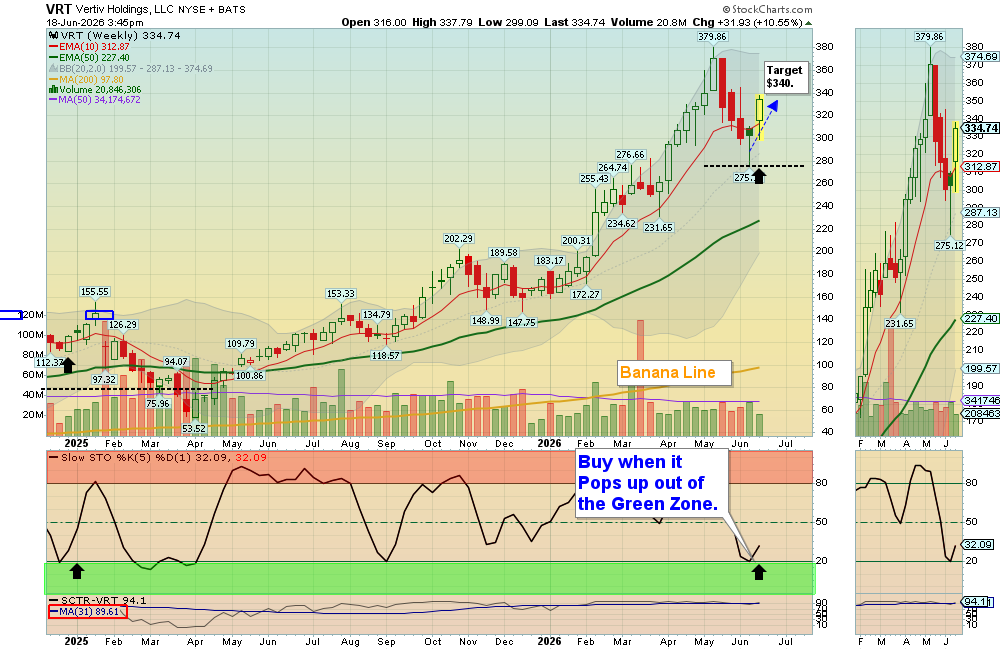
NEW SUBSCRIBERS: NOW the Leaders have come back down to the Green Zones for Buy Signals soon.  This is what we wait for. Also good when the S&P 500 Index is also back down in the Green Zone. 


Bonds  were up slightly today.  

Crude Oil was up $0.73 today at $19.57.


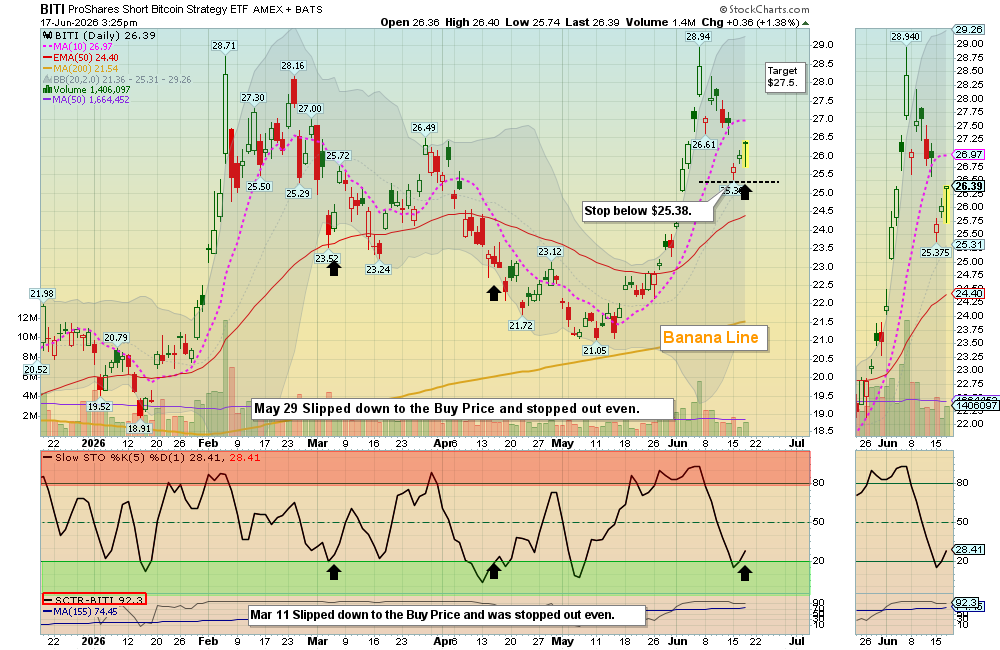
The Following Investments will probably have a Money Wave Buy Signal soon. (Slow Stochastic Closing > 20) on today’s Close.

BUYS TODAY    5/01/2020    


VXX     VOLATILITY INDEX      Money Wave Buy today.  VXX will not be logged as it is already up 10 % today.

We will “Not Log” trades if the Reward/Risk is not at least 2:1.


Money Wave Buys Signals Soon (Short Term):   (Best to Buy these when the S&P 500 is also in the Green Zone.)    


“JUMP START” Candidates:  (Buy Signal should be very soon… Click on the Jump Start link for more info.)   

TDOC     TELADOC HEALTH 

WMT     WALMART INC.   

_______________________________________________________________________________________________________________________________________________   

AMD     ADVANCED MICRO       

INO     INOVIO PHARM.     Money Wave must Close in the Green Zone.

LLY     ELI LILLY & CO.


RWM     INVERSE SMALL CAP FUND     Buy if it Closes above the Pink Line of $43.17. (2nd Entry soon)        

XBI     BIOTECH FUND

ZM     ZOOM VIDEO


Please be patient and wait for Money Wave Buy Signals.  We will email you when they are ready. Click on Watch List.

Emotions are very high now, so please do not Buy unless you are VERY NIMBLE.

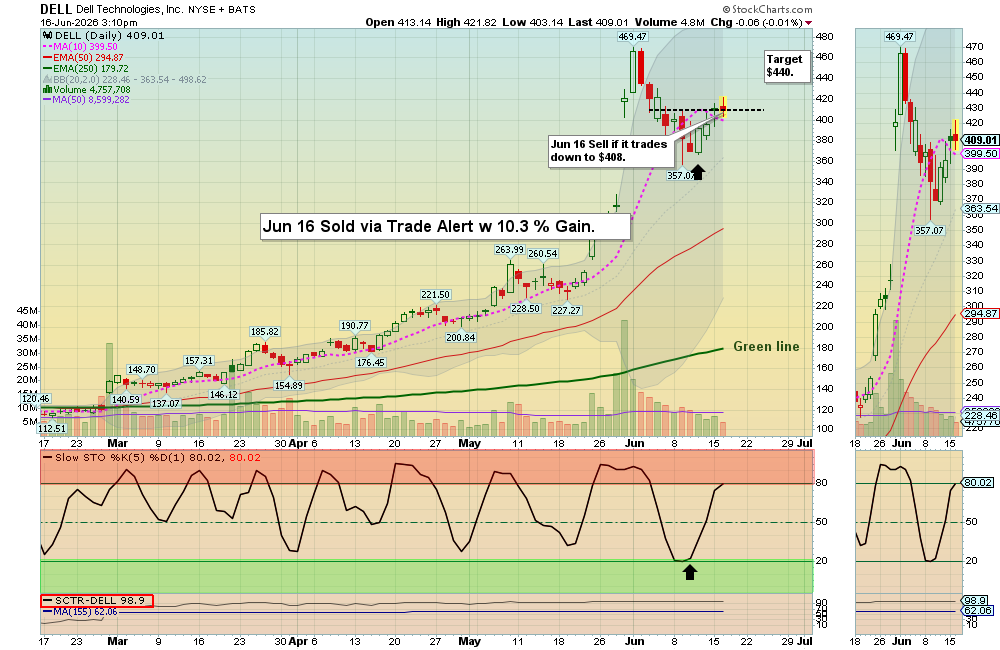
The Leaders are Way Above the Green Lines (all Investments eventually return to their Green Lines).

___________________________________________________________________________________________________

SELLS TODAY   


BABA     ALIBABA GROUP     LOWER the Sell Stop Loss below the Green Line of $191.27. BABA gapped down today on Bad News. Try to Sell up around $201.50 soon.

QQQ     NASDAQ 100 FUND       EXIT if it is going to Close below the Pink Line around $213.07. 

VIPS     VIPSHOP HOLDINGS     EXIT if it is going to Close below the Red Line of $15.50.   


INO       INOVIO PHARMA.    EXIT if it is going to Close below the Pink Line around $12.20.  This trade was not logged.     

SHOP     SHOPIFY INC.    EXIT if it is going to Close below the Pink Line around $625.31.  This trade was not logged.     

UIS    UINISYS CORP.    EXIT if it is going to Close below your Buy Price, or $11.56.  This trade was not logged. 


Click for   PORTFOLIO  (Open Positions) and adjust your Sell Stops. 

Click for  CLOSED POSITIONS, 

NEW ETF SECTOR ROTATION SYSTEM   (LINK)

NEW! TOP 100 LIST Updated Mar 31, 2020


Many like to Buy the day before, near the Close, if the Money Wave is going to create a Buy Signal (Closing > 20 and out of the Green Zone).

Don’t Buy if the Investment has already popped up too much. Money Wave Buys are usually good for a 3-6 %  move in a few days.

We will “Not Log” trades if the Reward/Risk is not at least 2:1.


HAVE A SAFE WEEKEND!

Related Post

– Money Wave Alert! Apr 30, 2020

Subscribe to Our Newsletter

AGL Logo

Get our eBook Now!

Candlestick - A Swing Traders Friend

We don’t spam! Read our privacy policy for more info.

You’ve been successfully subscribed to our newsletter!

Voted #1 at Stock Charts

SH Chart
Inverse S&P 500 Fund (SH) will have a Money Wave Buy today.

Help Us Help Animals

Help Us Help Animals

Recent Comments

  • Market Breadth Indicators: A Trader’s Guide to Early Trend Detection on Backtesting: Definition and How a Trading Strategy Backtest Works
  • Island Reversal Pattern: Definition and Formation Explained on Double Top Pattern: How to Identify and Trade This Reversal Signal
  • Channel Pattern Guide: What It Is and Why It Matters on A Guide to Forecasting Using Moving Averages
  • What Is a Broadening Bottom Chart Pattern? Full Guide on Bull vs. Bear Market: An Investor’s Guide to Market Phases
  • ATGL Weekly Money Flow - 2025-05-11 on ATGL Top Pick of the Week! Apr 6, 2025

Become a Green Liner!

Help me make more Money in the Stock Market.

ON ATGL

  • DashBoard
  • Weekly Commentary
  • Daily Buy / Sell Signals
  • Day Trade Setup
  • Trading Rooms

Design & Develop By Pixelvect

STRATEGIES

  • Swing Trading
  • ATGL Pick of the Week
  • Dividend Growth
  • ETF Sector Rotation
  • Dogs of the Dow

HELP

  • ATGL Trading Rules
  • FAQ
  • Account Maintenance
  • Contact US
  • Join

FOLLOW US

Instagram Linkedin Twitter Facebook

© COPYRIGHT 2024 · ABOVETHEGREENLINE.COM · ALL RIGHTS RESERVED · PRIVACY · TERMS · CONTACT · WATCHLIST · CURRENT