By Author
Updated March 13, 2026
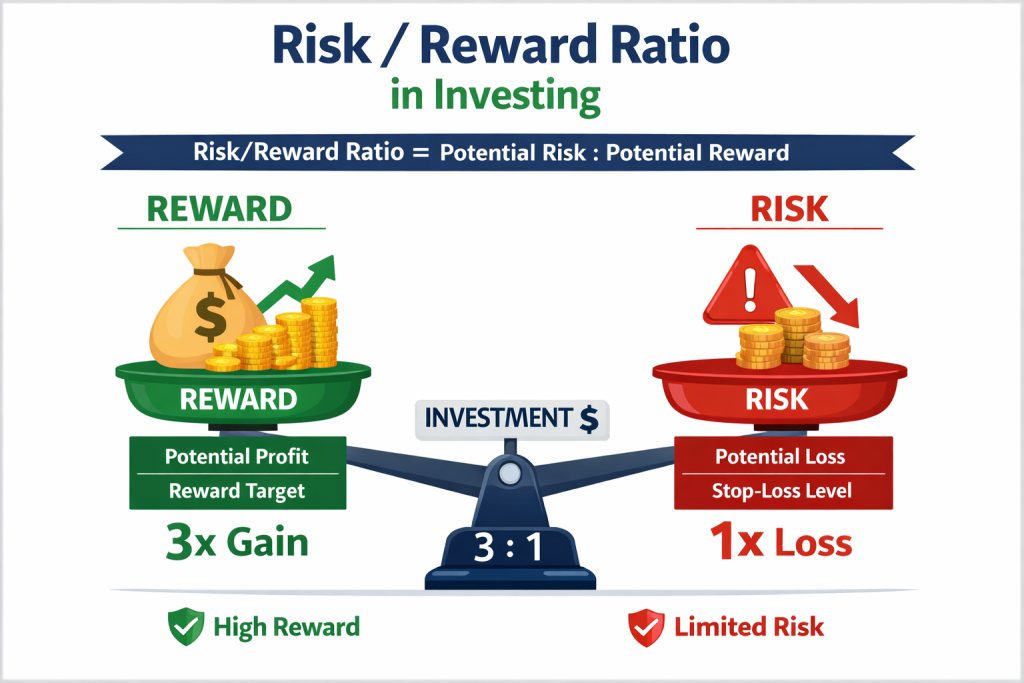
What is the Risk/Reward Ratio?
Investing in the market, especially individually, comes with a lot of risks that one should attempt to protect themselves from. A great way to safeguard your investment is to use a risk/reward ratio. The risk/reward ratio is a method used by traders to describe the potential reward (or profit) an investor may earn in relation to each dollar he/she risks (also known as loss potential). As previously mentioned, this approach is employed by traders to decide which trades to take and normally is applied to individual stocks.
Evaluating potential reward relative to downside risk is a fundamental step in building disciplined trading and investing approaches. Investors interested in how risk management principles, position sizing, and trade selection fit into broader market approaches can explore the Investment Strategy Guide, which explains how structured strategies help guide investment decisions.
According to Investopedia, a good risk/reward ratio is anything at or above 1:3. What does that mean? The ratio 1:3 represents that for every dollar invested there is a potential to earn three dollars.
Important Components of the Reward/Risk Ratio
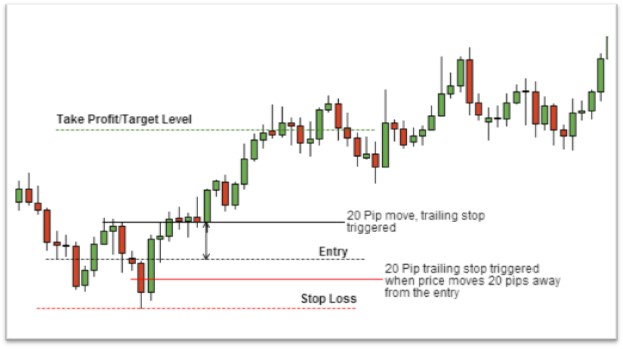
Stop-Loss Orders
Stop-loss orders are an important component of the risk/reward ratio because they limit an investor’s loss on stock and protect their profit. This is accomplished by setting a stop price that when reached, automatically sells the stock as a market order. For instance, an investor may set the stop price at 10% lower than his entry price; if the market price of the stock drops by further than 10%, the stop order becomes a market order and is sold at the next available opportunity. It is important to note that setting a stop-loss order does not guarantee the safety of your investment as stock prices can plunge rapidly. For example, if an investor bought a share of a stock for $100 and set the stop-loss order at $90, but the stock suddenly drops by 50%, the market order would be prompted and the stock would be sold even though its price would be well below the stop-loss order.
Profit Targets
On the contrary, a profit target is set to ensure an investor will sell in a profitable position. An investor may set a profit target the moment they make a trade or they may add/change a profit target depending on the release of new information concerning the investment. Profit targets are useful in many different ways when it comes to managing risk. For one, in high-risk scenarios, the price of a security can change on the flip of a dime. Therefore, for an investor to sell at a desirable price would require a lot of attention and time that many of us are not able to give. Setting a profit target ensures an investor will sell at his goal price without him/her having to do the work themselves. Secondly, many people buy a share or multiple shares of a stock and wind up gaining profit but aren’t sure when it is time to sell. Investors will sometimes hold out hoping for more profit than already gained, but this can be a dangerous game. Setting a profit target initially will ensure that an investor keeps himself/herself on track to gain profit without great loss.
Bringing It All Together
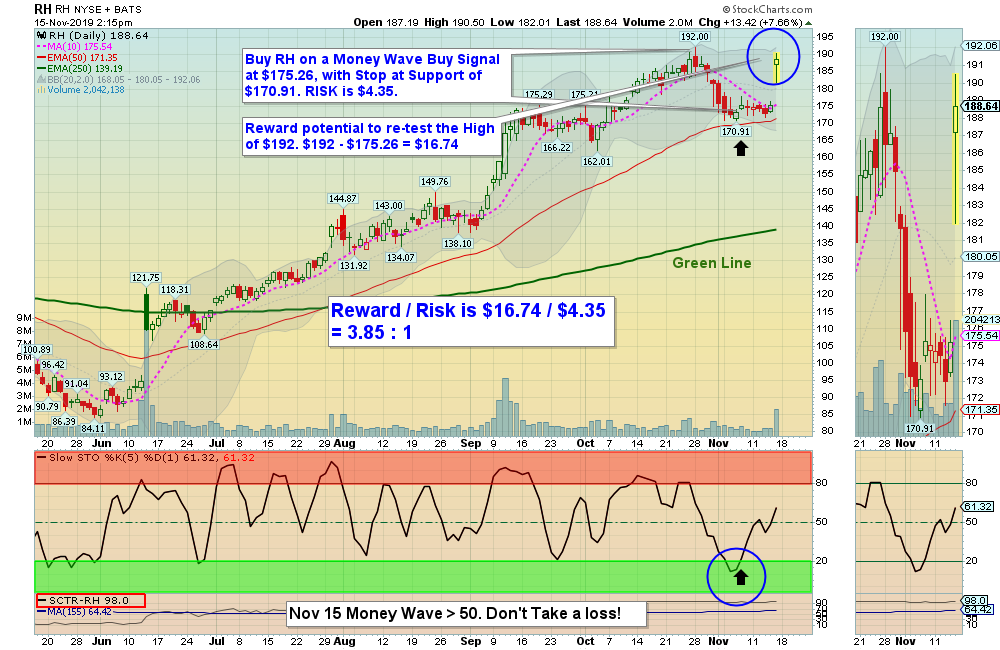
At the end of the day, each trader is going to have their own risk/reward ratio that best suits their needs and desires, however, using that desired ratio to calculate the stop-loss is what becomes important. For the sake of this example, let’s say our risk/reward ratio is 1:3. If you saw a stock was selling at $30 but was recently priced at $38, and you believe it will again be priced at $38, maybe you would buy a share for a potential reward of $8. To find what your stop-loss would be set at, you would need to divide the profit target ($8) by the ratio (8/3 = 2.67). Then, you would subtract that quotient from the price which you initially bought the share (30 – 2.67) to find your stop-loss ($27.33).
Many traders make the mistake of not utilizing the risk/reward ratio as they view it as a useless mechanism. In reality, the risk/reward ratio is one of the most powerful trading tools; some would argue it is impossible to trade profitably without it.
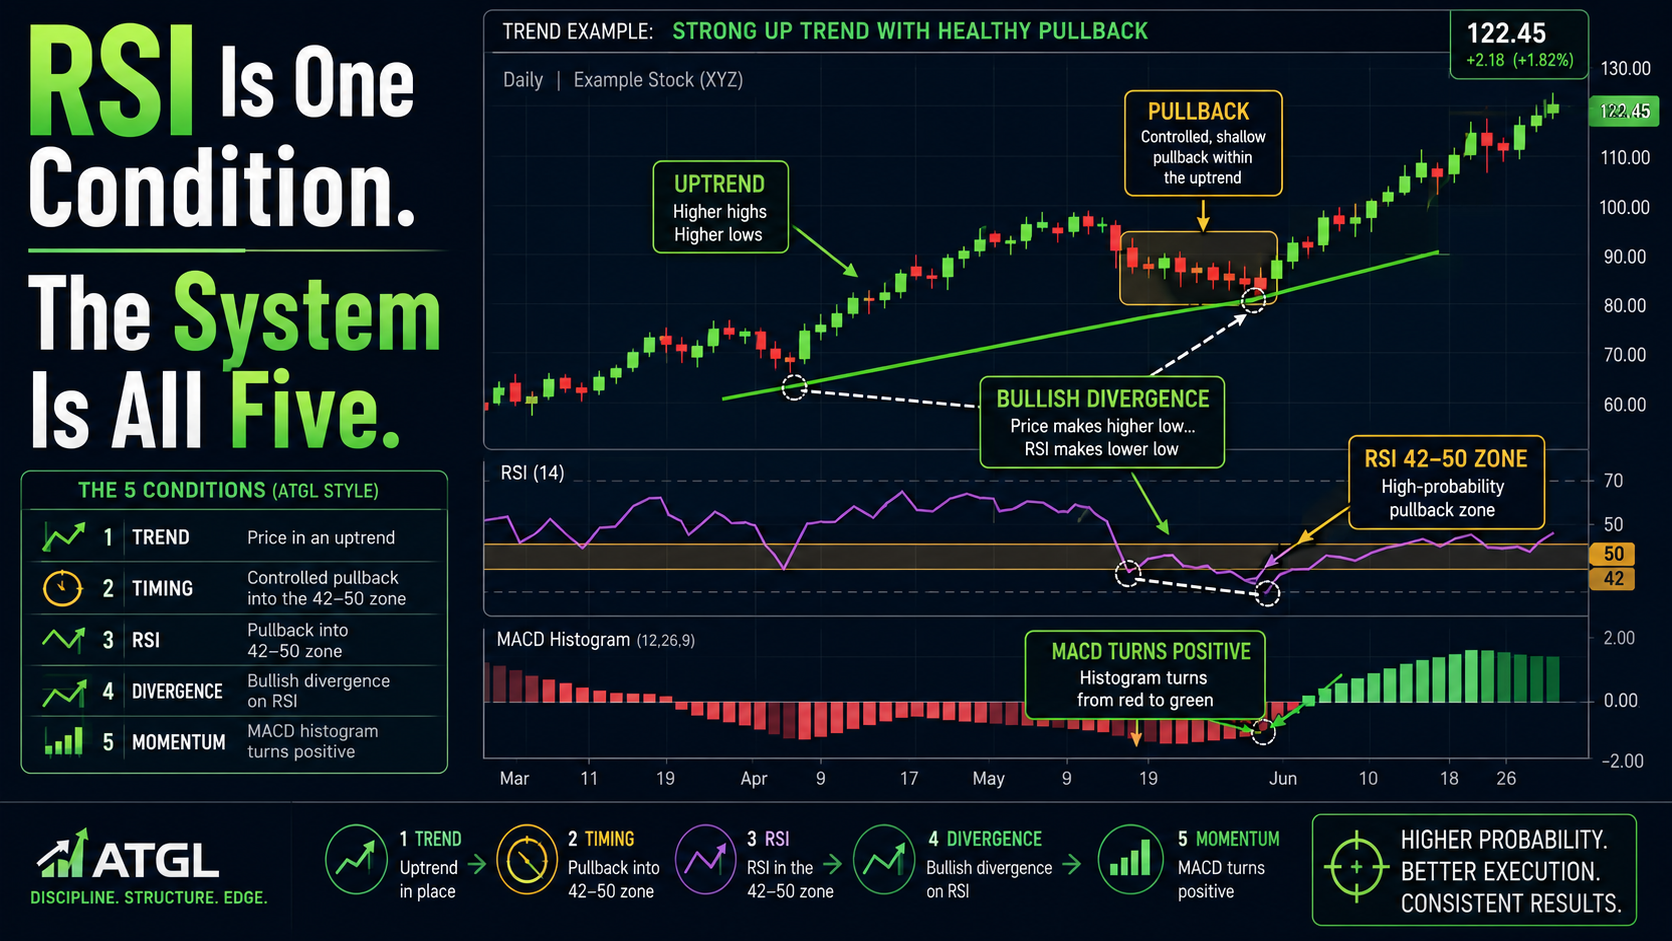
Follow the Rules: Above the Green Line + Above 90 Relative Strength

Related Articles
[pt_view id=”b1ac254g2i”]