
11/13/2022 Markets were sharply higher for the week as the Herd has now decided that Inflation has peaked. Smart Money already knew that, and bought before the 5000 point DOW 30 Index rally up from the October lows.
The US Dollar has finally dumped down, and long term Interest Rates have come down, which has helped both Stocks and Bonds move up. But the Dollar and long term Interest Rates should have enough upward momentum to re-test the recent highs again (UUP & TBT Buys soon). Markets have moved up very quickly on “Good News” and are over-bought for the short term.
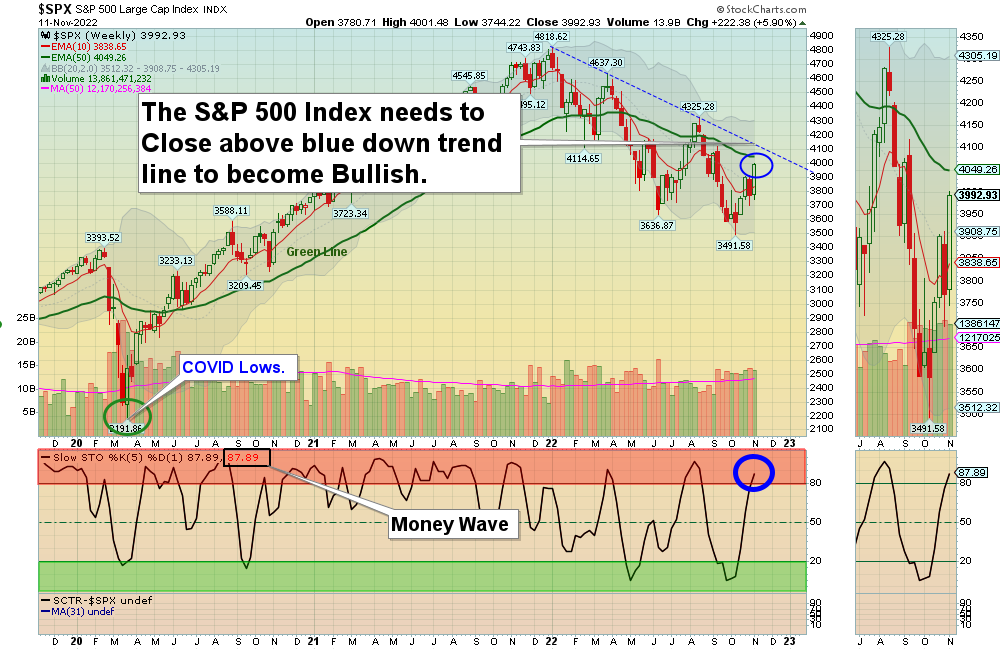
We will probably raise some Cash on the “Good News” soon and wait for the Media to create another mild FEAR dump. The weak NASDAQ 100 and Big Tech have bounced up recently but are nowhere close to breaking the down trend like the DOW 30 and S&P 500 Indices.
If you continue to Follow the Green Line System, your Money should flow into the Strongest areas and your account value should be able to grow in both Bull and Bear Markets.
________________________________________________________________________________________________________________________________________________
For the week the Dow was up 4.21%, the S&P 500 was up 5.89%, and the NASDAQ 100 up 8.80%. Currently the major Stock Indices (except the DOW 30) are Below the Green Lines and have low Relative Strength (own stronger Securities here).
The Inflation Index (CRB) was down 0.61% for the week and is Above the Green Line, indicating Economic Expansion.
Bonds were up 3.90% for the week, and are Below the Green Line, indicating Economic Expansion.
The US DOLLAR was down big 4.16% for the week and is Above the Green Line.
Crude Oil was down 3.94% for the week at $88.96 and GOLD was up 5.54% at $17.69.40.
More action this week on the Day Trading Scrolling Charts.
DAY TRADING CHARTS FOR INDICES & LARGE CAPS.
We have not had many intra-day Trade Alert signals lately as the Volume has been too Low with the Buy Signals. These low Volume Buy Signals tend to pop up and quickly fade back down. We like to see High Volume on rallies.
_____________________________________________________________________________________________
MONEY WAVE BUYS SOON:
We are in now in 9 logged Current Positions for the Short & Medium Term. There are 3 investments on the Short Term Watch List.
Be patient and WAIT for Green Zone Buy Signals!
LONG TERM INVESTMENTS: (Hard to find many Long Term now because most normal Investments no longer have 80 Relative Strength required.)
Long Term Scrolling Charts (Real Time)
AVXL ANAVEX LIFE SCIENCES Wait for the next Daily Money Wave Buy Signal.
BLU BELLUS HEALTH Buy if it Closes above $9.84 with High Volume.
CROX CROX INC. Wait for the next Daily Money Wave Buy Signal.
PBR PETROBAS ENERGY Wait for the next Weekly Money Wave Buy Signal.
SIGA SIGA TECH. Wait for Close back Above the Green Line.
VIPS VIPSHOP HOLDINGS Buy if it Closes above $13.32 with High Volume. (now in Stage 1 Base).
______________________________________________________________________________________________________
My Trading Dashboard
Swing Trading Scrolling Charts
Day Trading Scrolling Charts
Click for Watch Lists
Click for Current Positions
Click for Closed Positions
Updated Top 100 List Nov 1, 2022
Dividend Growth Portfolio
Updated ETF Sector Rotation System
Dogs of the DOW System
Long Term Strategy for IRAs & 401k Plans
CNN Fear & Greed Index
Scrolling Stage Chart Investing Charts
Alert! Market Risk is High (RED). The probability of successful Short Term Trades is better, when the % of stocks above the 50-day avg. is below 20.
Tell your Friends about the Green Line, and Help Animals.
________________________________________________________________________________
Albert writes ” I signed up for Trade Alerts by Twitter but NEVER get a notification from you.”
Then BUY immediately! EXIT if the Stock falls below the Pink Dotted Line (10-hour average).Keep refreshing the page for updated “Real Time” Charts. Works best when the Volume is High.
Thanks for writing!
ATGL
Related Post
– BLU


