
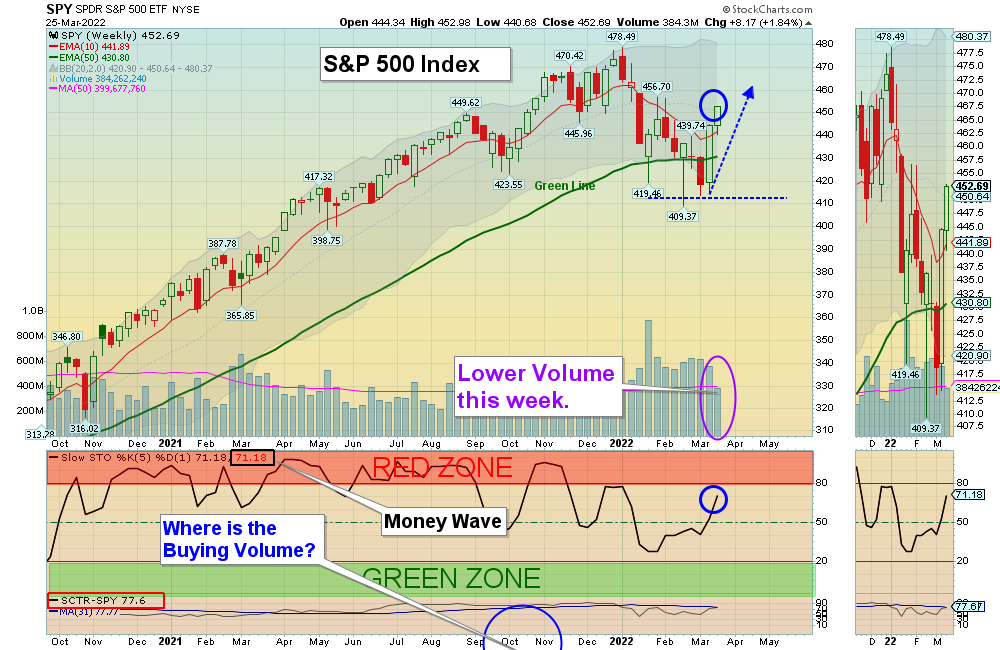
3/27/2022 Markets were higher again for the week as the buying continued, but the Volume was lower. It is amazing how the FEAR has disappeared and Tammy is Buying again. And the majority of the investment newsletter writers were Bearish, so we did the opposite (Sentiment Indicator) and the Indices have rallied 9 % up from last week’s lows.
Now the Strongest Funds (Click) and those that were able to hold Above the Green Lines must make New Highs again for the Markets to remain Bullish. This year has been difficult so far for most to make much money, but there should always be investments for Smart Money to rotate into.
If you continue to Follow the Green Line System, your Money should flow into the Strongest areas and your account value should be able to grow in both Bull and Bear Markets.
There has been slower action this week on the Day Trading Scrolling Charts.
DAY TRADING CHARTS FOR INDICES & LARGE CAPS.
We have not had many intra-day Trade Alerts lately as the Volume has been too Low on Buy Signals. We like to see High Volume on rallies.
For the week the Dow was up 0.39%, the S&P 500 was up 1.84%, and the NASDAQ 100 was up 2.36%. The Long Term Trend for the Indices is up.
The Inflation Index (CRB) was up 0.39% for the week and is Above the Green Line, indicating Economic Expansion.
Bonds were down 3.58% for the week, and are Below the Green Line, indicating Economic Expansion.
The US DOLLAR was up 0.61% for the week and is Above the Green Line.
Crude Oil was up 10.49% for the week at $113.90 and GOLD was up 1.29% at $1954.20.
_____________________________________________________________________________________________
MONEY WAVE BUYS SOON
We are in 6 logged Current Positions for the Short & Medium Term, and we have CASH to Buy 4 more soon. There are 4 investments on the Short Term Watch List.
Be patient and WAIT for Green Zone Buy Signals!
_________________________________________________________________________________________
LONG TERM INVESTMENTS (many Large Caps no longer have 80 Relative Strength required.)
Long Term Scrolling Charts (Real Time)
AMD ADVANCED MICRO Wait for the next Daily Money Wave Buy Signal.
F FORD MOTOR CO. Buy if it Closes above the Red Line of $18.07 with High Volume.
NVDA NVIDIA CORP. Wait for the next Daily Money Wave Buy Signal.
RRPIX RISING INTEREST RATES FUND Buy above $30.20 with a 5% Trailing Sell Stop Loss below it.
XLK TECH FUND Wait for the next Daily Money Wave Buy Signal.
XLRE REAL ESTATE FUND Wait for the next Daily Money Wave Buy Signal.
________________________________________________________________________________
My Trading Dashboard
Swing Trading Scrolling Charts
Day Trading Scrolling Charts
Click for Watch Lists
Click for Current Positions
Click for Closed Positions
Updated Top 100 List Mar 1, 2022
Dividend Growth Portfolio
ETF Sector Rotation System
Dogs of the DOW System
Long Term Strategy for IRAs & 401k Plans
CNN Fear & Greed Index
Scrolling Stage Chart Investing Charts
Alert! Market Risk is MEDIUM (Yellow). The probability of successful Short Term Trades is better, when the % of stocks above the 50-day avg. is below 20.
Tell your Friends about the Green Line, and Help Animals.
________________________________________________________________________________
Raymond L writes” Thank you. I enjoy looking at your work, and how easy and simple you make it.”


