
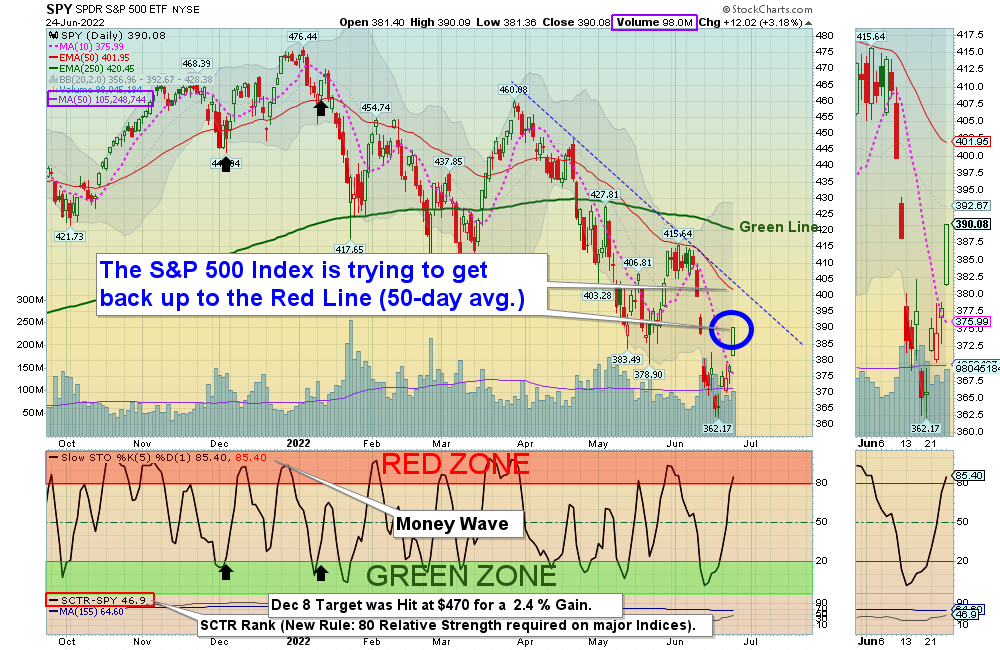
6/25/2022 Markets were up sharply for the week as Commodities & Oil fell, and long term Interest Rates dropped. The Stock Indices were very over-sold for the Short Term because of temporary emotional FEAR. And eventually the FEAR dissipates, so Smart Money BUYS. Then the Markets should rally back up near the Red Lines (50-day avgs.).
The strongest Leaders are now back in the Green Zones for Buy Signals soon. A big Market sell off like we had helps us identify which investments are the strongest. Energy Stocks should be setting up for another re-test of the Highs soon.
T-Bonds bounced up 6.5 % from the lows, but Bonds should go back down once more to re-test last week’s low. And Inverse T-Bonds Fund (TBF) should re-test last week’s High. When T-Bonds finally rally back up towards the Green Line, many investors will be surprised that long term Interest Rates can fall while the FED is tightening on short term rates.
Last week, tangible Commodities were Way Above the Green Lines, and Bonds were Way Below the Green Lines. Both will eventually return to the Green Lines, so maybe we will see a Stock Market rally when Interest Rates and Inflation fall.
If you continue to Follow the Green Line System, your Money should flow into the Strongest areas and your account value should be able to grow in both Bull and Bear Markets.
More action this week on the Day Trading Scrolling Charts.
DAY TRADING CHARTS FOR INDICES & LARGE CAPS.
We have not had many intra-day Trade Alert signals lately as the Volume has been too Low with the Buy Signals. These low Volume Buy Signals tend to pop up and quickly fade back down. We like to see High Volume on rallies.
For the week the Dow was up 5.46%, the S&P 500 was up 6.62%, and the NASDAQ 100 was up 7.46%. Currently the major Stock Indices are Below the Green Lines (AVOID and own stronger Investments here).
The Inflation Index (CRB) was down 3.41% for the week and is Above the Green Line, indicating Economic Expansion.
Bonds were up 0.43% for the week, and are Way Below the Green Line, indicating Economic Expansion.
The US DOLLAR was down 0.51% for the week and is Way Above the Green Line.
Crude Oil was down 0.34% for the week at $107.62 and GOLD was down 0.56% at $1830.30.
_____________________________________________________________________________________________
MONEY WAVE BUYS SOON
We are in now in 9 logged Current Positions for the Short & Medium Term. There are 7 investments on the Short Term Watch List.
Be patient and WAIT for Green Zone Buy Signals!
_________________________________________________________________________________________
LONG TERM INVESTMENTS (Hard to find many Long Term now because most normal Investments no longer have 80 Relative Strength required.)
Long Term Scrolling Charts (Real Time)
ABBV ABBVIE INC. Up 10 % for the week. Wait for next Daily Money Wave Close > 20 with High Volume.
MOS MOSIAC CO. Wait for the next Weekly Money Wave Buy Signal with High Volume.
NUE NUCOR CORP. (Steel) Wait for the next Weekly Money Wave Buy Signal with High Volume.
PBR PETROBRAS ENERGY Wait for the next Weekly Money Wave Buy Signal with High Volume.
TWNK HOSTESS BRANDS INC. Weekly Money Wave Buy, but the Volume was not High.
_______________________________________________________________________________
My Trading Dashboard
Swing Trading Scrolling Charts
Day Trading Scrolling Charts
Click for Watch Lists
Click for Current Positions
Click for Closed Positions
Updated Top 100 List Jun 3, 2022
Dividend Growth Portfolio
Updated ETF Sector Rotation System
Dogs of the DOW System
Long Term Strategy for IRAs & 401k Plans
CNN Fear & Greed Index
Scrolling Stage Chart Investing Charts
Alert! Market Risk is Low (GREEN). The probability of successful Short Term Trades is better, when the % of stocks above the 50-day avg. is below 20.
Tell your Friends about the Green Line, and Help Animals.
________________________________________________________________________________
QUESTION: Winter writes ““Don’t take a Loss” confuses me. What does that mean?”
ANSWER: When the Investment has a Money Wave Buy Signal, it should pop up 3-6 % in just a few days.
If it is not popping up well, and the Money Wave > 50, either Get out, or Don’t Take a Loss!
Something must be Wrong. There will be plenty more… Raise Cash, and don’t get Stuck! Wait for the next one.
Good trading and tell your friends!
ATGL


