
MARKETS WILL BE CLOSED ON MONDAY FOR JUNETEENTH FEDERAL HOLIDAY
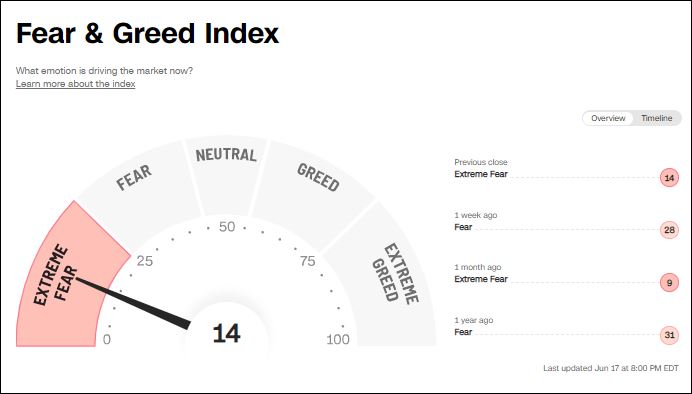
6/19/2022 Markets were down sharply for the week as the FED raised short term Interest Rates, and now many are betting a Recession is coming. Maybe so, but currently the Indices are very over-sold for the Short Term because of temporary emotional FEAR. And we know that FEAR levels always dissipate in humans after reaching a Climax. Once that happens, Smart Money will normally recognize that the Selling is drying up, and BUY. Eventually the Markets should rally back up near the Red Lines (50-day avgs.).
The good news is that the strongest Leaders are now back in the Green Zones for Buy Signals soon. A big Market sell off like we had helps us identify which investments are the strongest. Energy Stocks should be setting up for another re-test of the Highs soon.
Unfortunately for the Bond Bulls, T-Bonds made a new low this week and Inverse T-Bonds Fund (TBF) made a new High. But T-Bonds did not collapse and were only down slightly for the week. If T-Bonds just had a “False Breakdown” we could see long term Interest Rates begin to fall.
Currently the tangible Commodities are Way Above the Green Lines, and Bonds are Way Below the Green Lines. Both will eventually return to the Green Lines, so maybe we will see a Stock Market rally when Interest Rates and Inflation fall. (Big surprise for Dumb Money.)
If you continue to Follow the Green Line System, your Money should flow into the Strongest areas and your account value should be able to grow in both Bull and Bear Markets. We had profits this week on Inverse T-Bond Fund, Inverse Small Cap Fund, Inverse ARK Fund, and the US DOLLAR FUND.
More action this week on the Day Trading Scrolling Charts.
DAY TRADING CHARTS FOR INDICES & LARGE CAPS.
We have not had many intra-day Trade Alert signals lately as the Volume has been too Low with the Buy Signals. These low Volume Buy Signals tend to pop up and quickly fade back down. We like to see High Volume on rallies.
For the week the Dow was down 4.76%, the S&P 500 was down 5.74%, and the NASDAQ 100 was down 4.90%. Currently the major Stock Indices are Below the Green Lines (AVOID and own stronger Investments here).
The Inflation Index (CRB) was down 5.15% for the week and is Above the Green Line, indicating Economic Expansion.
Bonds were down 1.49% for the week, and are Way Below the Green Line, indicating Economic Expansion.
The US DOLLAR was up 0.32% for the week and is Way Above the Green Line.
Crude Oil was down 10.51% for the week at $107.99 and GOLD was down 1.867% at $1840.60.
_____________________________________________________________________________________________
MONEY WAVE BUYS SOON
We are in now in 7 logged Current Positions for the Short & Medium Term. There are 7 investments on the Short Term Watch List.
Be patient and WAIT for Green Zone Buy Signals!
_________________________________________________________________________________________
LONG TERM INVESTMENTS (Hard to find many Long Term now because most normal Investments no longer have 80 Relative Strength required.)
Long Term Scrolling Charts (Real Time)
ABBV ABBVIE INC. Wait for next Weekly Money Wave Close > 20 with High Volume.
ACI ALBERTSONS CO. Wait for the next Daily Money Wave Buy Signal with High Volume.
NUE NUCOR CORP. (Steel) Wait for the next Daily Money Wave Buy Signal with High Volume.
TWNK HOSTESS BRANDS INC. Wait for next Weekly Money Wave Close > 20 with High Volume.
_______________________________________________________________________________
My Trading Dashboard
Swing Trading Scrolling Charts
Day Trading Scrolling Charts
Click for Watch Lists
Click for Current Positions
Click for Closed Positions
Updated Top 100 List Jun 3, 2022
Dividend Growth Portfolio
Updated ETF Sector Rotation System
Dogs of the DOW System
Long Term Strategy for IRAs & 401k Plans
CNN Fear & Greed Index
Scrolling Stage Chart Investing Charts
Alert! Market Risk is Low (GREEN). The probability of successful Short Term Trades is better, when the % of stocks above the 50-day avg. is below 20.
Tell your Friends about the Green Line, and Help Animals.
________________________________________________________________________________
QUESTION: Jim S. writes “Why do you use the 250 vs 200 day or any other moving average? And, in a bear market, are you concerned that your Money Wave (slow sto line) might get stuck in the Green Zone for an extended period or give false breakout buy signals?
ANSWER: Hi Jim. The 250-day average (Green Line) has been back tested and has fewer “false Sell Signals” than the 200-day. The question should be: Why do most investors use the inferior 200-day average?
In the next Bear Market, we should be in Inverse Funds (like SH) which we were in the 2008 Bear (with good success)… In a Bear Market, most investments will be Below the Green Lines. The Green Line Rules do not allow us to Buy weaker investments Below the G L.
But historically there will always be investments Above the Green Lines, and we should have them for you.
Good trading and tell your friends!
ATGL


