
08/09/2020 Markets were up again for the week as the S&P 500 Index is now back up to the All Time High in Feb. The NASDAQ 100 Index is on New Highs mainly because of huge moves on Amazon, Apple, Google & Microsoft. The broad New York Stock Exchange Index is well off the Highs, along with the Small Cap Index, DOW 30 Index and the World Index.
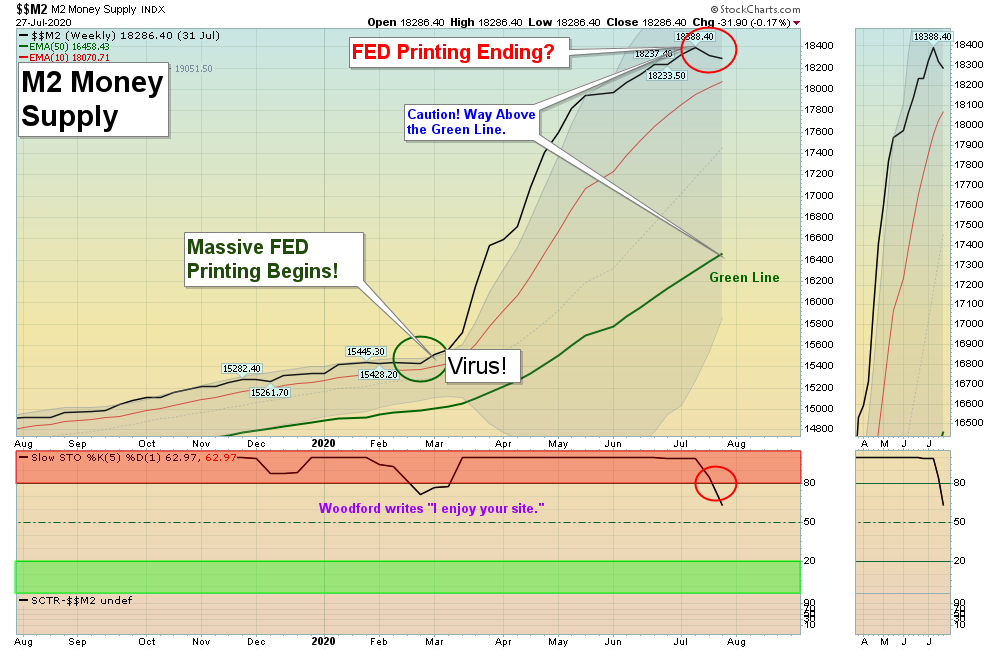
Most are hoping that when the Covid 19 really settles down or a vaccine is created, the Markets will go much higher. But Stocks are probably already priced for that, and a stronger Economy would normally cause Long Term Interest Rates to go up (Bonds would Sell off). Rising Long Term Interest Rates would hurt many industries like Housing. The FED has created much of the Market rally since March by pushing Rates down near 0 % and also pumping extra Money into the Money Supply (see chart above). Most likely the FED will stop the massive pumping on any substantial good news about Covid 19. Then we will see if the Markets can hold up on their own.
There should normally be plenty of Sellers soon up at the Feb Highs (Resistance), so a pullback down to the 50-day average or below could create a “Cup & Handle” Pattern back up. Or the Markets could be forming a massive “Double Top” of the 11 year Bull Market (Bearish). We will have to wait and see.
We like to Buy Investments that have recently made New Highs, on pullbacks. These are NASDAQ 100 (QQQ), Semiconductor Fund (SMH), BioTech Fund (XBI), Internet Fund (FDN), Gold Fund (IAU) and Silver Fund (SLV), but they are currently over bought (so we wait for pullbacks). Some of the Strongest Leaders are 50 – 100 % Above the Green Lines on FOMO Buying (Fear of Missing Out). The Leaders might go a little Higher, but based on history they will correct. Those expecting a big rally from this point will normally be disappointed. Tammy needs to get Flushed Out again, like she was at the February Highs, as her GREED has kicked in.
For the week the Dow was up 3.8%, the S&P 500 was up 2.47%, and the Nasdaq 100 was up 2.14%. The Long Term Trend for the Indices is up.
The Inflation Index (CRB) was up 2.20% and is Below the Green Line, indicating Economic Weakness.
Bonds were down 0.54% for the week and are Above the Green Line, indicating Economic Weakness.
The US DOLLAR was down o.20% for the week and is Below the Green Line.
Crude Oil was up 2.36% for the week at $41.22 and GOLD was up 2.12% at $2028.00, a New High.
_____________________________________________________________________________________________
MONEY WAVE BUYS SOON
We are currently in 3 logged Current Positions, for the Short & Medium Term. There are 7 Investments on the Short Term Watch List.
Be patient and WAIT for Green Zone Buy Signals!
______________________________________________________________________________________________
LONG TERM INVESTMENTS (Most of the Leaders are back up in the Weekly Red Zones.)
Buy the Leading Investments that are down near the Weekly Green Zones.
AUY YAMANA GOLD Wait for the next Daily Money Wave Buy. All time High is $18.50.
FCEL FUELCELL ENERGY INC. Buy if it Closes above $3.42 on High Volume. All time High is $682.00.
GPRO GOPRO INC. Buy if it Closes above $5.79 on High Volume. All time High is $98.00.
KIRK KIRKLAND’S INC. Wait for the next Daily Money Wave Buy. All time High is $29.50.
RIOT RIOT BLOCKCHAIN INC. Wait for the next Daily Money Wave Buy. All time High is $46.20.
______________________________________________________________________________________
Click for Current Positions
Click for Watch List
Click for Closed Positions
Dividend Growth Portfolio (we are now posting a Dividend Calendar for the entire portfolio to assist with planning purposes).
ETF Sector Rotation System – New Quarterly Rotation was on June 30 & July 1, 2020.
Long Term Strategy for IRAs & 401k Plans
Alert! Market Risk is MEDIUM (Yellow Zone). The probability of successful Short Term Trades is better, when the % of stocks above the 50-day avg. is below 20.
Tell your Friends about the Green Line, and Help Animals
___________________________________________________________________________________________


