
As CryptoDataDownload posted the “Purpose of Back testing” the cautious investor may ask: “Is it possible to simulate the performance before putting money at risk?” This is the essence of Back testing: a simulation to determine how well a strategy performs over a historical time period. This is important because the markets themselves are always changing. An investment strategy that may have worked for years may not work tomorrow if something shifts in the markets. Therefore, it is important to see how the strategy performs, and to test the strategy against different time periods.
Above the Green Line utilized www.marketinout.com to analyze the ATGL investment strategy. MarketInOut defines how there back testing simulator works. “When you create a stock screening strategy that contains all necessary criteria and the selected historical year for comparison, back testing applies this information and simulates trades for every matched stock based on each day of the selected year. Any matching stocks will be put into your virtual portfolio and any that are not will be ignored. Even if some stocks, however, do match the criteria, they will still be ignored if there are no vacant positions in the portfolio. Traders typically do not add a large number of stocks to their portfolio, because its purpose is to control risks (20-30 stocks generally suffice). Portfolio size can be specified along with other parameters during strategy creation. Also, if some stocks in the virtual portfolio conform to exit criteria, stop loss, or take profit condition, the corresponding position will be closed. Users can specify the criteria for closing positions. In this case, stocks that were purchased earlier are sold and will be reflected in simulated trades. The position is then closed which allows for vacancies in the portfolio.”
It must be noted that Back testing simulators are NOT perfect and there are limitations. This is true with the simulator at MarketInOut. The ATGL System does not close a position at a Stochastic > 80, like the back test model did. AGTL Stops Out on a Close below the 10-day average. Unfortunately this is NOT possible to program exactly at MarketInOut.
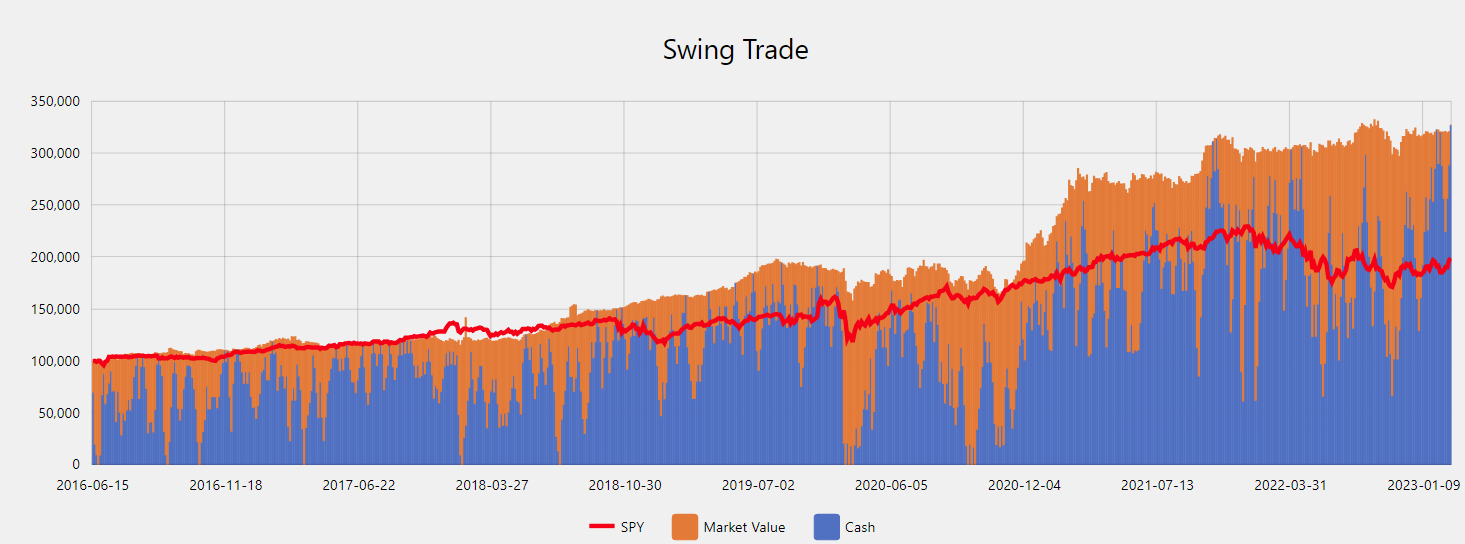
Below are two Figures that show hypothetical results when back testing the ATGL System. Initial Capital: $25,000, Capital at Risk: 20% per trade, Portfolio Max Size: 5 positions. The first figure shows the hypothetical accumulated return when following the ATGL System for the past 10 years. The second figure shows the hypothetical total annual and monthly return for each year.
The goal is to illustrate how lots of smaller percentage trades (Since 6/15/2016 Beginning) can add up (before taxes & commissions).
A snapshot of the daily updates that help traders stay aligned with market direction.

Above The Green Line’s systematic approach has completely transformed my trading. I’ve gone from inconsistent results to reliable gains, even during market downturns.”
The systematic approach has been a game-changer for my portfolio. I no longer second-guess my trading decisions and have seen consistent returns even in volatile markets.”
Sarah K.
Michael R.
Engineer & Part-time Trader
The community aspect is invaluable. Being able to learn from experienced traders and discuss strategies in real-time has accelerated my trading knowledge tremendously.
David L.
Business Owner