
Technical analysis is a trading discipline for evaluating investments and identify trade opportunities by analyzing statistical trends gathered from trading activity, such as volume & price movement.
Do You Want a System That Gives You the EDGE to Beat the Markets?
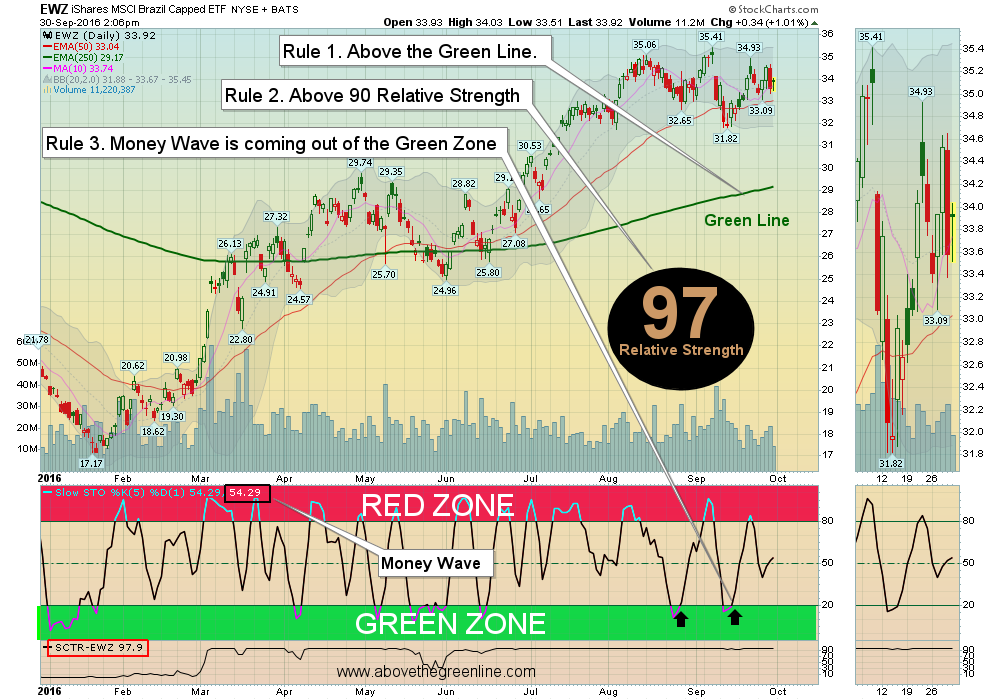
How? Follow these 3 Rules:
Check out our resources on investing to find more information on Technical Analysis and Investing in general.
We will email or text you when to Buy Investments from our Stock, ETF and Commodity pages. Buy when they are coming out of the Green Zone, and take profits in the Red Zone. Split your account into 3-8 positions with Sell Stop Losses. Your email or Twitter account @AboveGreenLine will have Entry Points and Sell Stop losses, or follow on our Positions Page.
All Investments eventually RETURN to their Green Line. (Above or Below the Green Line, is temporary human emotion.)
Disclaimer: The information provided herein is not to be construed as an offer to buy or sell Investments of any kind. The Investment selections on this website are not to be considered a recommendation to buy or sell any Investment but as is a mere form of expression of the writer. All information offered by Above the Green Line is for educational purposes only. Readers are urged to check with their own investment counselor before making any investment decisions.
A snapshot of the daily updates that help traders stay aligned with market direction.

Above The Green Line’s systematic approach has completely transformed my trading. I’ve gone from inconsistent results to reliable gains, even during market downturns.”
The systematic approach has been a game-changer for my portfolio. I no longer second-guess my trading decisions and have seen consistent returns even in volatile markets.”
Sarah K.
Michael R.
Engineer & Part-time Trader
The community aspect is invaluable. Being able to learn from experienced traders and discuss strategies in real-time has accelerated my trading knowledge tremendously.
David L.
Business Owner