Stock Ideas and Market Analysis
The Stock ideas and Market analysis presented below are generated by 3rd Party news feeds. Its a collection of articles, reports, and insights from industry-recognized third parties such as S&P Capital IQ, Dow Jones, and Credit Suisse. These resources provide a wealth of information on a broad range of stocks, ETFs, and investment strategies. You can access a variety of helpful tools and resources, like interactive charts, to help you validate new ideas. Our goal is to offer a centralized hub for individuals seeking timely and relevant information on key topics that can potentially impact markets and trading ideas. The ideas do NOT necessarily follow the Green Line Method for investing. If interested in learning more join Above the Green Line today.
-
Nifty IT - Market Structure & Corrective Path Study
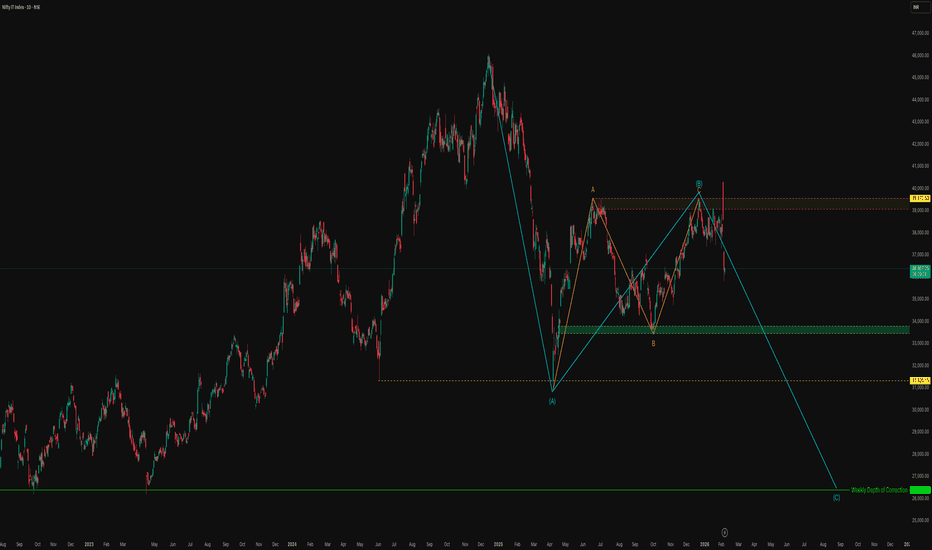 This study highlights the higher-timeframe corrective structure currently developing in NIFTY IT after the recent sharp decline. This view is based purely on technical analysis and current price action. The initial selloff marked a capitulation phase, where weak hands exited and smart money began absorbing supply. The rebound that followed reflects short covering and early accumulation, forming the first recovery leg. The pullback into the mid-zone shows profit booking by early buyers and hesitation from fresh participants — a classic sign of uncertainty after a strong move. Buyers stepped in again from this area, indicating demand presence, but the inability to sustain above resistance suggests distribution near highs. Current price action reflects a battle between trapped sellers trying to exit at breakeven and cautious buyers waiting for confirmation. This creates a sideways environment driven by indecision rather than conviction. Psychology behind the structure: Fear-driven selling created the bottom. Relief rally... Read more
 -
SILVER - Gave You The Perfect Trade
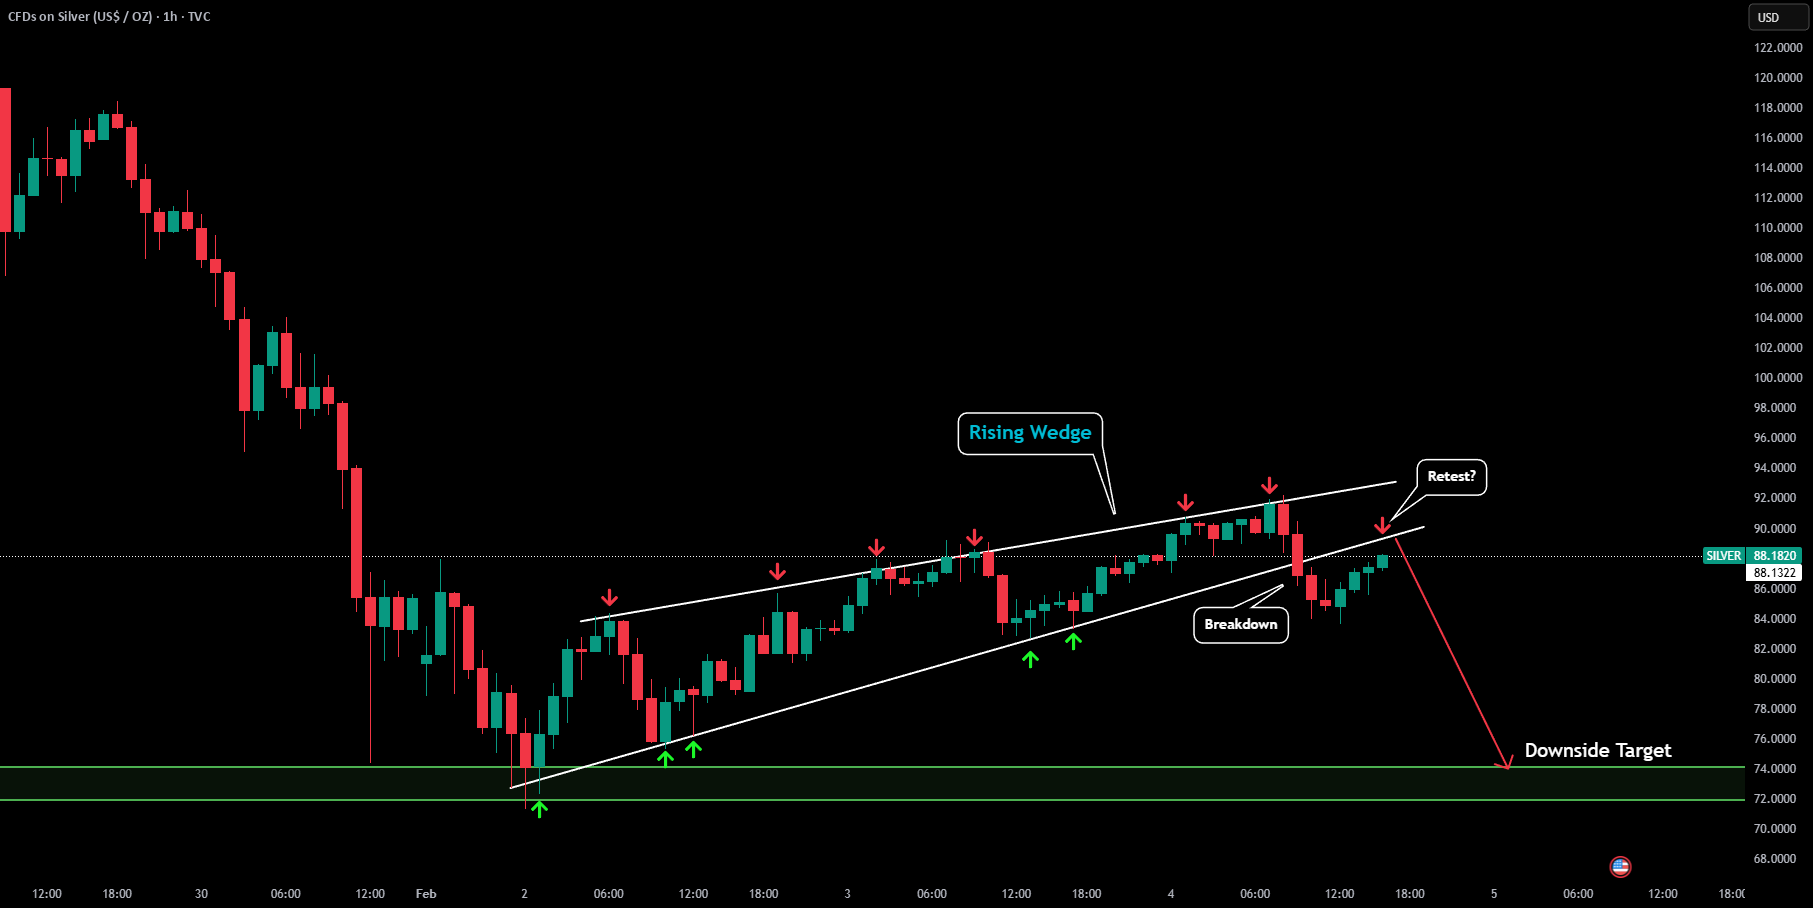 Here is an update to my last post: https://www.tradingview.com/chart/SILVER/HZJTncb6-SILVER-Potential-LTF-Rising-Wedge/ It is amazing how Viaquant continues to use its mathematical models and algorithms to predict the future. In this case we hit it spot on! Silver rallied to the trendline, then created an hourly doji reversal candle (right below the trendline), and over the next 2 hours dropped 17% to the top of the green box! Amazing how picture perfect these moves for Silver have been playing out! Follow @VIAQUANT for more!... Read more
 -
50k?
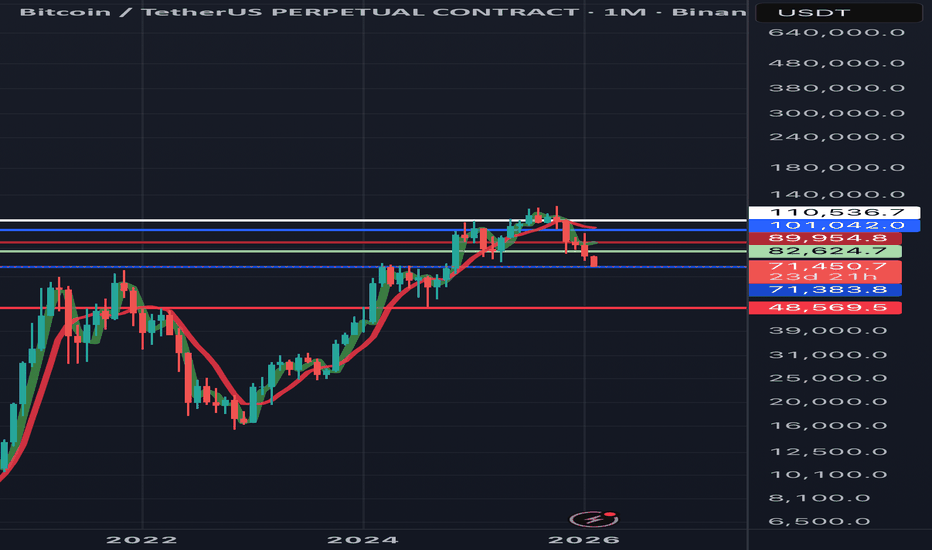 It’s going for it will it break this month .. I would like to think we get some kind of slight impulse that’ll pull alts up while BTC .D make it’s Down fall And May comes and we get the push down to 50k.... Read more
 -
#Silver Macro Plan
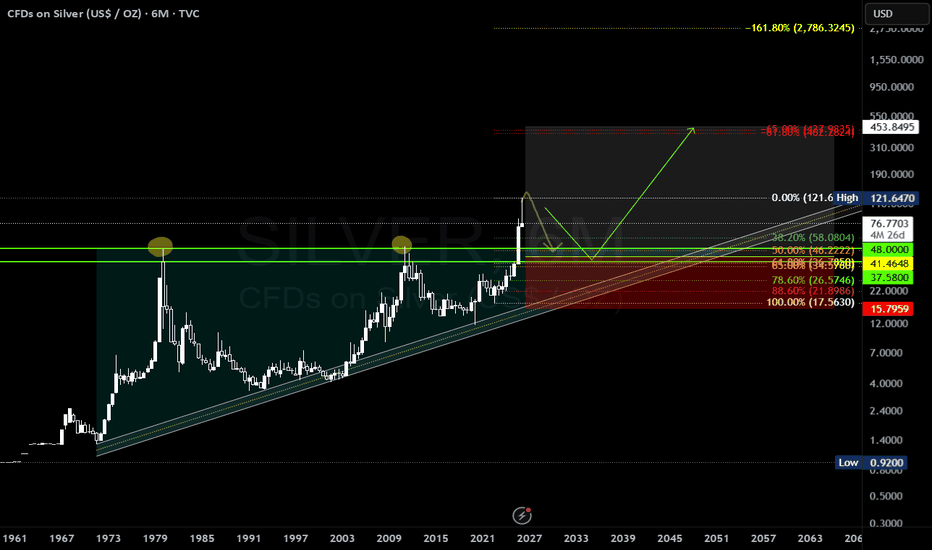 It's all coming together for silver on higher time frame, i had sold my silver buys from 37-40$ around 92-100$ range. This retest on 6M & 12M will be extremely important, if somehow we start closing 3M below the green zone range my idea will be invalid. But considering we are talking about one of the most traded commodities in the world & the way we have seen the volume i am happy to buy as much as i can for 2032 bull cycle.... Read more
 -
Gold time level Febinacci and technical analysis
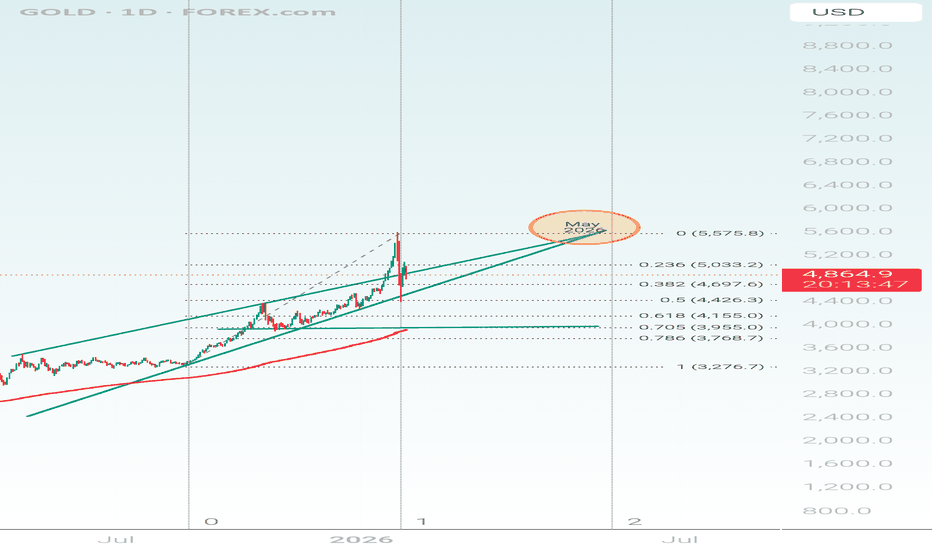 May 2026 can be a time zone. At the moment gold is going through a correction post parabolic move. Managing the liquidity is the most important thing to do.... Read more
 -
Sell XAUUSD
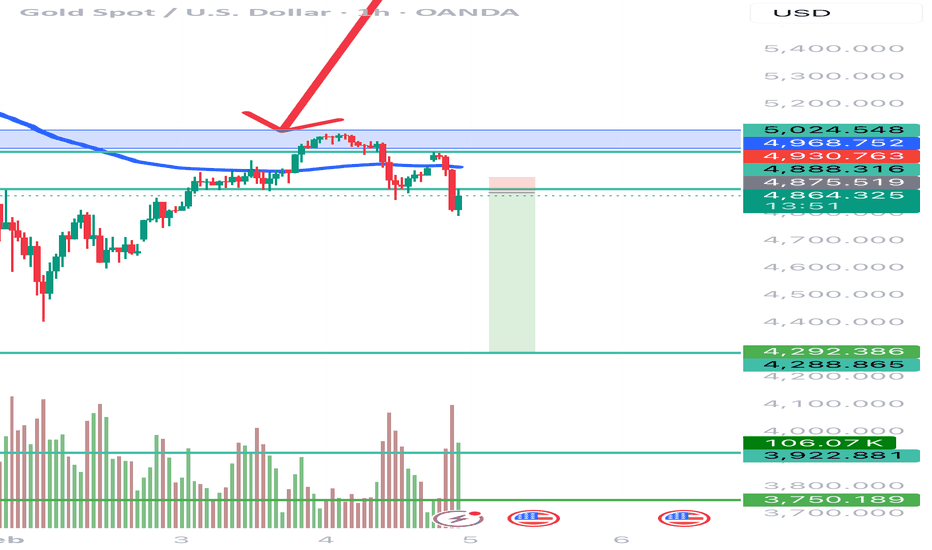 *I am in no way a financial advisor and you should always do your own due diligence before placing any trade. Do not trade what you are not comfortable with losing. No trade is guaranteed. Sell down to $4,350 Stop loss 4870... Read more
 -
Paper Trade Like Real Trading. Up $380
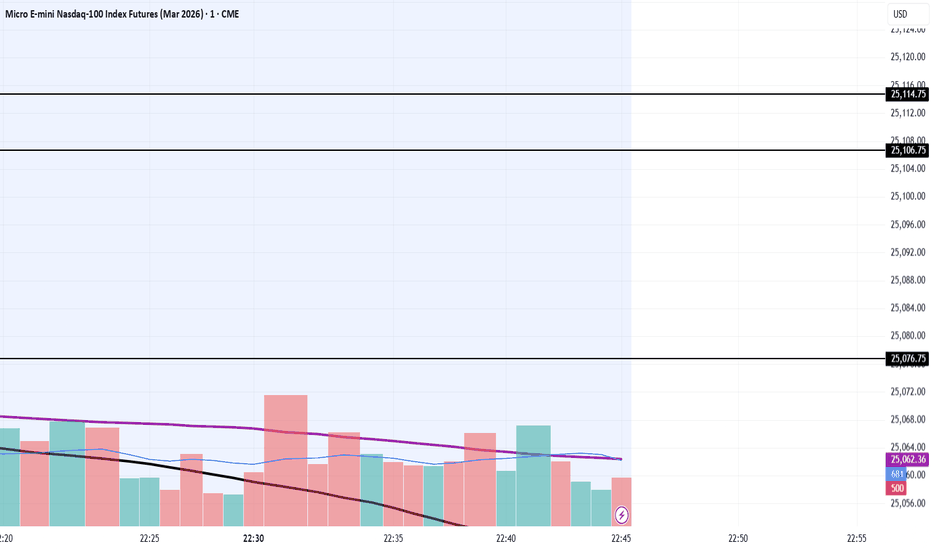 New York pm session approaching Power Hour. In this market you need to keep your stops tight and quit while you're up. Don't give back your wins.... Read more
 -
Drop
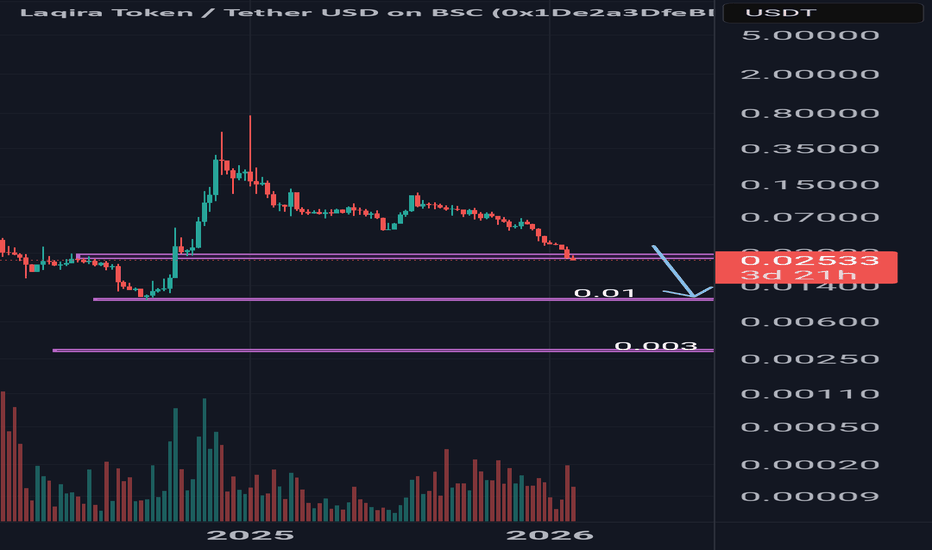 The drop of this cryptocurrency in the coming days Given that this coin is a scam, we will see further drops.... Read more
 -
Pero – Daily Trading Plan (XAUUSD) | 05/02/2025
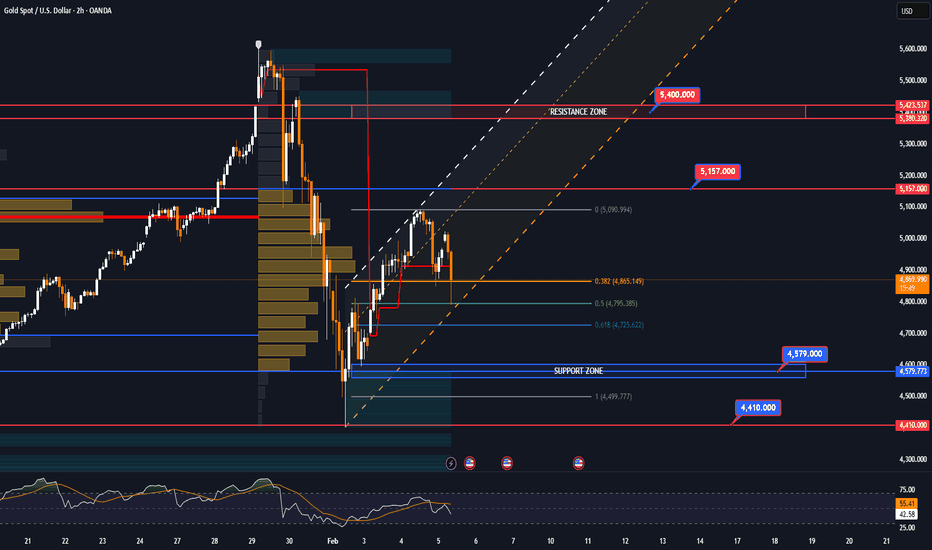 Pero – Daily Trading Plan (XAUUSD) | 05/02/2025 1️⃣ Market Context (H2 Structure) On the H2 timeframe, the market has: ✅ Completed Wave 1 following a strong rebound from the recent low 📍 Price is now near the 0.5 Fibonacci retracement (~4,795) of Wave 1 → This is a textbook area for Wave 2 completion ➡️ This supports the view that the current pullback is a healthy correction, not a trend reversal. Primary narrative for today: Wave 2 completion → look for BUY opportunities to hold into Wave 3, while SELL trades are limited to scalping only. 2️⃣ Elliott Wave Mapping (H2) Wave 1: Clearly formed from the 4,580 area up to ~5,090 Wave 2: Corrective move into the 0.5 – 0.618 Fibonacci zone Structure aligns with a typical abc correction Wave 3 (Expectation): As long as the 0.5–0.618 zone holds, the probability of an impulsive Wave 3 is high... Read more
 -
Bullish Gartley in WEL
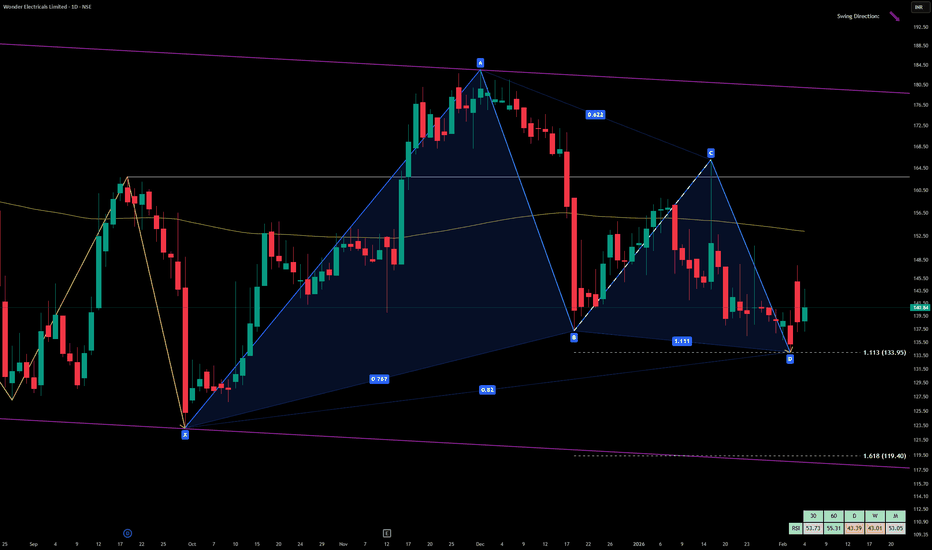 Harmonic Pattern Report — Wonder Electricals Volume: Stable institutional activity Current Price Context: Trading near completion zone 📐 Pattern Geometry & Ratios AB = 0.767 of XA → Close to ideal 0.618, acceptable variant BC = 0.622 of AB → Within valid range (0.382–0.886) CD = 1.111 of BC → Valid extension, aligns with Gartley rules AD extension = 1.113 of XA → Near textbook 0.786–0.886 completion zone 📊 Technical Context Point D (PRZ) around ₹133.95–₹119.40 — potential reversal zone RSI (Daily = 43.39, Weekly = 43.01) → Neutral to slightly oversold, supportive of reversal Moving averages show price stabilizing near support levels Swing direction arrow currently down, but harmonic completion suggests a bullish turn ✅ Verdict: Wonder Electricals has completed a Bullish Gartley harmonic pattern, with Point D aligning near the 0.786–0.886 XA retracement zone. The structure signals a potential bullish reversal from the ₹119–₹134 zone. Bias: Long positions... Read more
 -
Revisited bearish level Gold under pressure
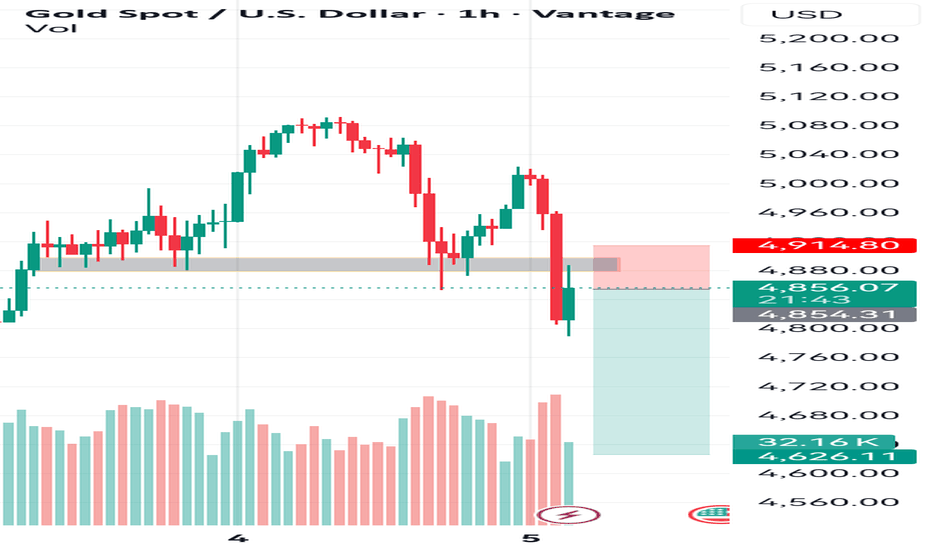 This morning opened with a indecision candlestick. Bears took over seeing buyers lost momentum on their buying level. And engulfing level went below 5000 causing uncertainty and bulls giving into its volume/momentum fade. This idea suppose to happen on that first dip but market found support where price is playing at 4885 4745 first target for bears... Read more
 -
Gold (XAU/USD) Price Outlook – Trade Setup
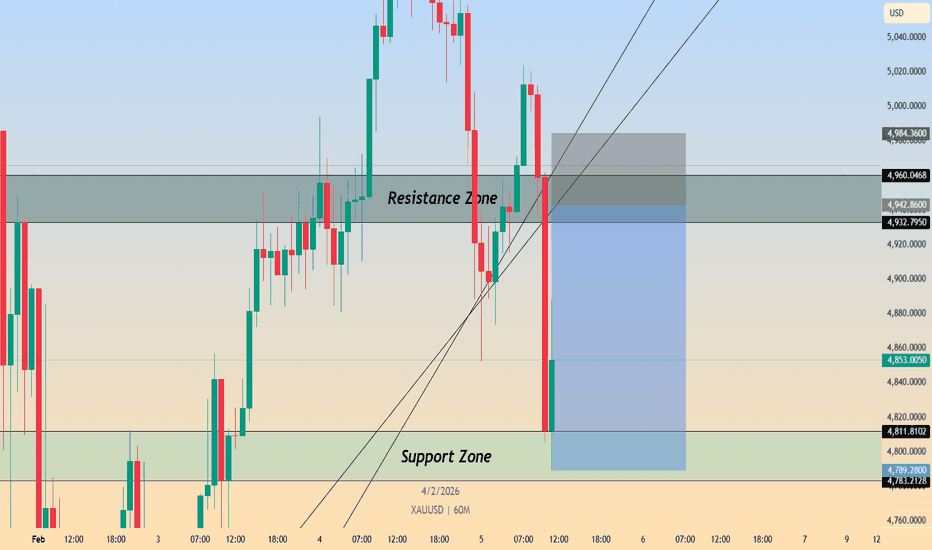 📊 Technical Structure TVC:GOLD Gold has failed at the $4,932–4,960 resistance zone and subsequently broken down sharply, slicing through the rising trendline and losing short-term bullish structure. The impulsive bearish candle confirms a rejection from resistance and signals a shift into a corrective / pullback phase. Price is now trading below the former breakout area, with momentum favouring the downside as long as Gold remains capped beneath the $4,932–4,960 resistance band. 🎯 Trade Setup (Bearish Bias) Entry Zone: 4,932 – 4,960 Stop Loss: 4,985 Take Profit 1: 4,812 Take Profit 2: 4,780 Risk–Reward Ratio: Approx. 1 : 3.7 📌 Invalidation: A sustained recovery and close above $4,985 would invalidate the bearish setup. 🌐 Macro Background While geopolitical risks linked to US–Iran tensions continue to support Gold on a broader horizon, short-term price action reflects profit-taking and positioning adjustment after extreme volatility near record highs. In addition, the nomination of Kevin... Read more
 -
Gold price movement analysis today!
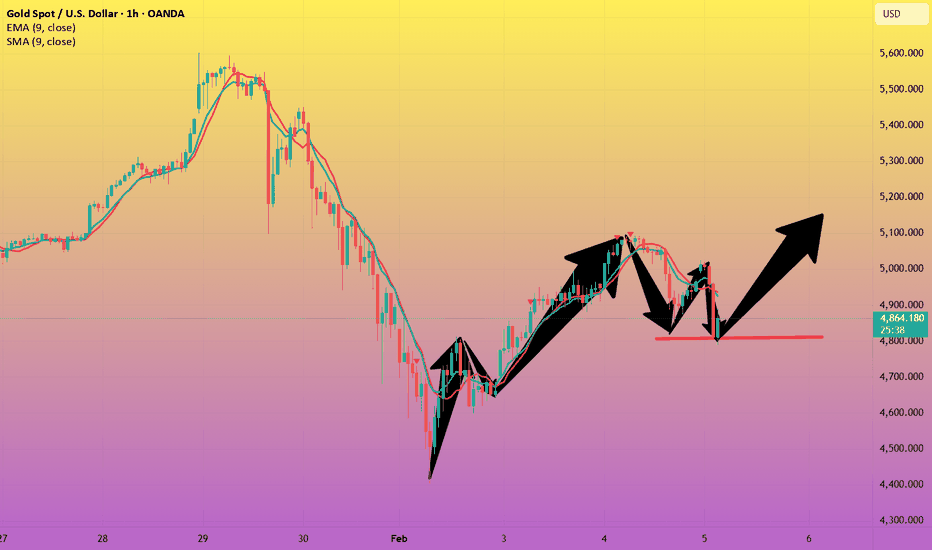 Market News: On Thursday (February 5th) in early Asian trading, spot gold opened higher but then fell. Yesterday, London gold prices experienced extremely volatile fluctuations, with international gold prices surging by $5091 before falling sharply, dropping as much as $4853 intraday, ultimately closing with only a slight increase. The main reason for the decline in international gold prices from their highs was the strengthening of the US dollar and profit-taking pressure from traders. The market is oscillating wildly between euphoria and caution, with traders awaiting new directional guidance. This week, US economic data will include the Job Openings and Labor Force Mobility Survey (JOLTS) and initial jobless claims for the week ending January 31st. Analysis of gold price movements over the next three days: The international gold market is currently caught in a fierce struggle between short-term adjustment pressure and long-term upward momentum. In the coming week, the market will... Read more
 -
Elliott Wave Analysis XAUUSD – February 5, 2026
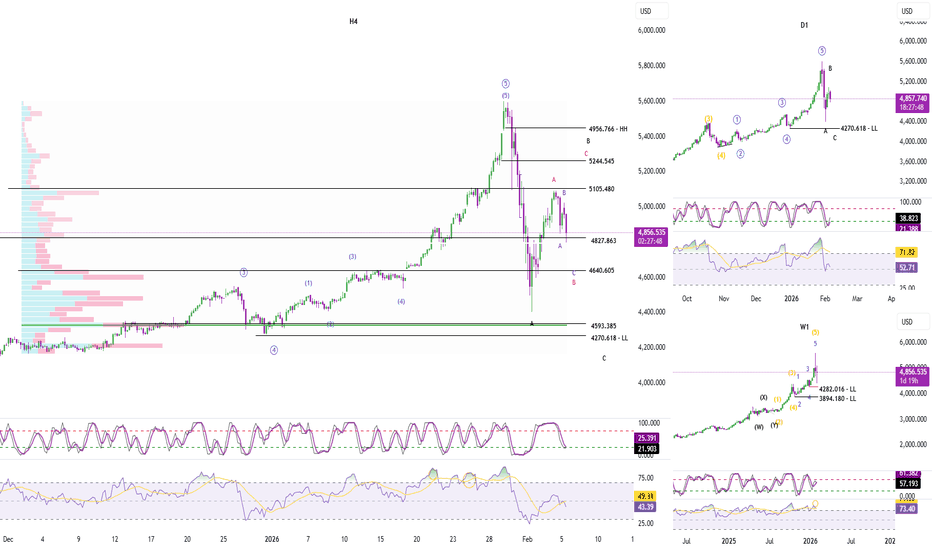 1. Momentum Weekly Momentum (W1) – Weekly momentum is currently showing signs of a bearish reversal. However, we need to wait for the weekly candle to close in order to confirm this reversal. – If the reversal is confirmed, the market is likely to enter a declining or sideways phase lasting at least several weeks. Daily Momentum (D1) – Daily momentum is currently rising, which suggests that the market may continue to move higher or consolidate sideways over the next few days. – One important point to watch closely: if D1 momentum moves into the overbought zone without price creating a new high, this would be a strong signal confirming that the long-term bearish trend remains intact. H4 Momentum – H4 momentum is currently in the oversold zone and is preparing to reverse. – This suggests that a bullish reversal on the H4 timeframe is likely to occur today or... Read more
 -
XAU/USD(20260205) Today's Analysis
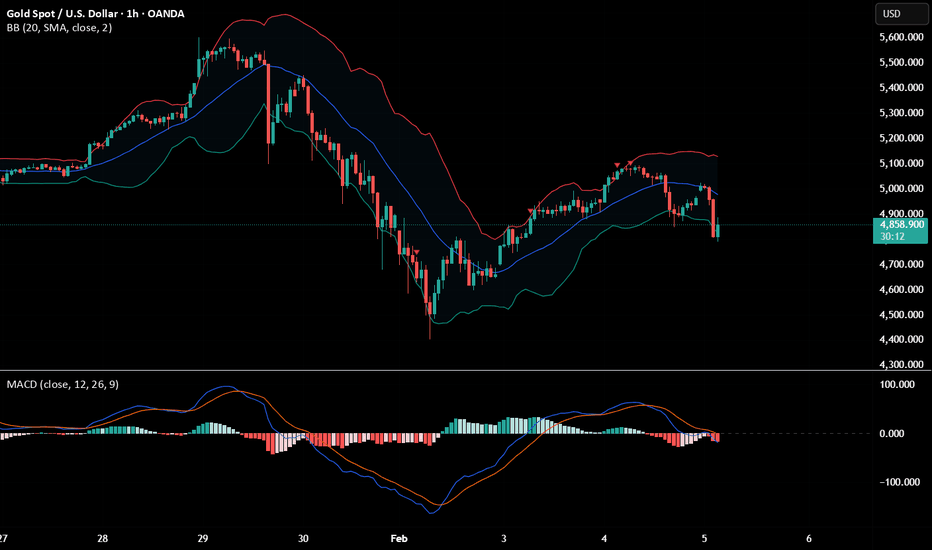 Market Update: The CEO of Amundi, Europe's largest asset manager, stated that the company is reducing its exposure to US dollar assets and shifting its focus to European and emerging markets. Valerie Baudson, who manages €2.4 trillion in assets, said Amundi will advise clients to reduce their holdings of US dollar assets over the next year. She warned that if US economic policies remain unchanged, "we will witness a continued weakening of the dollar." Technical Analysis: Today's Buy/Sell Threshold: 4970 Support and Resistance Levels: 5205 5117 5060 4880 4823 4736 Trading Strategy: A break above 5060 suggests a buy entry, with a first target price of 5117. A break below 4970 suggests a sell entry, with a first target price of 4880.... Read more
Market Analysis
No feed items found.


