
10/3/2021 Markets were lower this week, as the major Indices fell below the Red Lines (50-day avgs.) which caused many Short Term Investors to Go to Cash. The Selling has been mild, so the Indices should be able to re-test the Highs again in a few weeks.
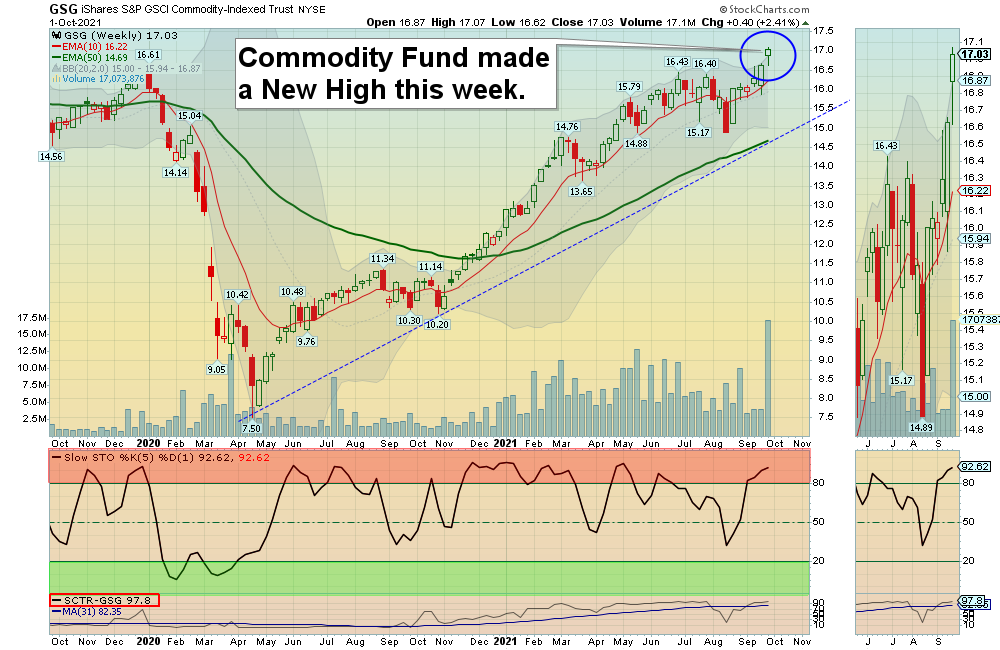
Long Term Bonds fell Below the Green Line this week on worries about Inflation. Lower Bond prices eventually cause higher Interest Rates on home mortgages. The FED tells us that there is little Inflation, or that Inflation is temporary and continues to Print. But we Follow the Money, and Commodity Prices (see Chart above) are telling us that Smart Money is flowing into Tangible Investments (which are still down 50% from the 2008 High), and out of Bonds (which are near a 40 year High).
If you continue to Follow the Green Line System, your Money should flow into the Strongest areas and your account value should be able to grow in both Bull and Bear Markets.
Most of our success lately has been using Triple Buy Signals on the Day Trading Scrolling Charts. Most trades have happened early in the morning.
The ETF Sector Rotation System moved into Financials, Energy, Retail, S&P 500, & Small Caps Funds on Oct 1st.
For the week the Dow was down 1.35%, the S&P 500 was down 2.18%, and the NASDAQ 100 was down 3.52 %. The Long Term Trend for the Indices is up.
The Inflation Index (CRB) was up 2.25% for the week (a New High) and is Above the Green Line, indicating Economic Expansion.
Bonds were down 0.94% for the week, and are back Below the Green Line, indicating Economic Expansion.
The US DOLLAR was up 0.76% for the week and is Above the Green Line.
Crude Oil was up 2.57% for the week at $75.88 and GOLD was up 0.38% at $1758.40.
_____________________________________________________________________________________________
MONEY WAVE BUYS SOON
We are currently in only 3 logged Current Positions, for the Short & Medium Term. There are 6 investments on the Short Term Watch List.
Be patient and WAIT for Green Zone Buy Signals!
______________________________________________________________________________________________
LONG TERM INVESTMENTS (A few Leaders have pulled back , but the Indices are near Highs.)
Long Term Scrolling Charts (Real Time)
ARKK ARK INNOVATIONS FUND Stopped Out this week as it Closed below the Green Line.
CLF CLEVELAND-CLIFFS INC. Buy if it Closes above the Red Line (50-day avg.) with High Volume.
EYES SECOND SIGHT MEDICAL Buy if it Closes above the Green Line (250-day avg.) with High Volume.
KOPN KOPIN CORP. Buy if it Closes above the Red Line (50-day avg.) with High Volume.
MGI MONEYGRAM INT’L. Buy if it Closes above the Red Line (50-day avg.) with High Volume.
______________________________________________________________________________________
My Trading Dashboard
Swing Trading Scrolling Charts
Day Trading Scrolling Charts
Click for Watch Lists
Click for Current Positions
Click for Closed Positions
Updated Top 100 List Oct 1, 2021
Dividend Growth Portfolio
ETF Sector Rotation System
Dogs of the DOW System
Long Term Strategy for IRAs & 401k Plans
CNN Fear & Greed Index
Scrolling Stage Chart Investing Charts
Alert! Market Risk is MEDIUM (Yellow Zone). The probability of successful Short Term Trades is better, when the % of stocks above the 50-day avg. is below 20.
Tell your Friends about the Green Line, and Help Animals.
______________________________________________________________________________________
4 Ways to Get your Daily Money Wave Alert:
-
- Emailed to your box between 3:40 3:50 pm EST.
- Website menu Commentary/Buy/Sell Signals
- Twitter notifications are the fastest @AboveGreenLine
- Text messages: Email us your Cell number & phone carrier.
Thank you,
ATGL
