
10/11/2020 Markets were up big for the week as the Indices are going back up to re-test the September Highs. Retail, Semiconductors, and Transports made New Highs, but Tech and the NASDAQ 100 Fund are weaker. Many Investors are frustrated as the broad New York Stock Index is still down 4.7 % for the year and they want a Plan to continue to make money after 11 years of a Bull Market.
Markets are currently High now based on Price / Earnings ratio, but most don’t care now with the FED Printing and super low Interest Rates. However, the FED can’t Print forever and has slowed down recently (see M2 Chart), and historically Long Term Interest Rates will rise with a growing Economy. Long Term Rates have risen from 0.83% in March to 1.6% now.
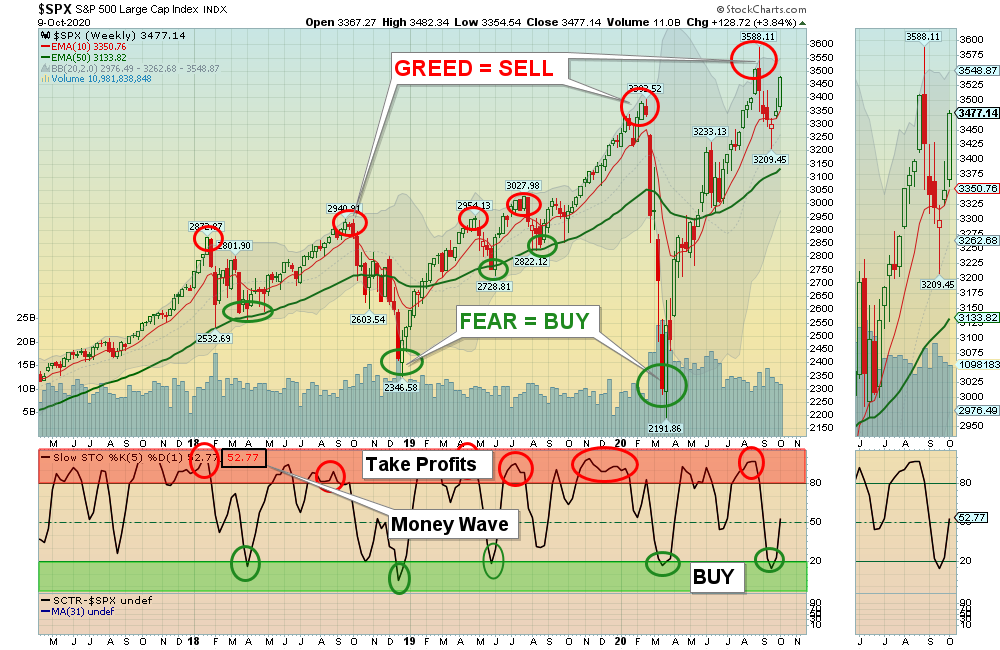
So what is the Plan? You can do like the Herd and HOPE that the Markets will go higher, or you can learn to Sell in the Red Zones and Buy in Green Zones. The Markets could easily stay in a sideways trading range for quite a while, where the “Buy & Hold” strategy might not make you any money. Last month the Indices became over-bought and quickly sold off 9 %. The Green Line System bought many Leaders on the drop, and captured some Gains this week:
HOME AT HOME INC. +15.84%
GOGO GOGO INC. +13.5% Gain
FCX FREEPORT MCMORAN +10.2%
SMH SEMICONDUCTOR FUND +7.9%
AMD ADVANCED MICRO +6.74%
SBSW SIBANYE STILLWATER +3.51%
EAT BRINKERS INT’L. -1.45%
AAPL APPLE INC. -3.55%
The Strongest Investments should re-test the recent Highs. The weak bounce so far on the FAANMG stocks is alarming.
PENNY STOCK WATCH LIST has many Green Zones Buy Signals soon that are 50-80% off the recent Highs.
For the week the Dow was up 3.27%, the S&P 500 was up 3.90%, and the Nasdaq 100 was up 4.16%. The Long Term Trend for the Indices is up.
The Inflation Index (CRB) was up 5.28% and is above the Green Line, indicating Economic Strength.
Bonds were down 1.63% for the week and are Above the Green Line, indicating Economic Weakness.
The US DOLLAR was down 0.91% for the week and is Below the Green Line.
Crude Oil was up 9.58% for the week at $40.60 and GOLD was up 0.98% at $1926.20.
_____________________________________________________________________________________________
MONEY WAVE BUYS SOON
We are currently in 7 logged Current Positions, for the Short & Medium Term. There are 4 Investments on the Short Term Watch List.
Be patient and WAIT for Green Zone Buy Signals!
______________________________________________________________________________________________
LONG TERM INVESTMENTS (Most of the Leaders are back up in the Weekly Red Zones.)
Buy the Leading Investments that are down near the Weekly Green Zones.
ADT ADT INC. Buy above the Red Line around $9.25.
ALT ALTIMMUNE INC. Buy above $15.63 on High Volume.
AUY YAMANA GOLD Bought on Friday above the Daily down-trend line of $6.05. Target is $9.86. EXIT if it is going to Close below $5.24.
FCEL FUELCELL ENERGY INC. Buy if it Closes above $3.42 on High Volume. All time High is $682.00.
RRC RANGE RESOURCES CORP. Popped up 24% this week.
RIOT RIOT BLOCKCHAIN INC. Popped up 19% this week.
______________________________________________________________________________________
Click for Current Positions
Click for Watch List
Click for Closed Positions
Dividend Growth Portfolio (we are now posting a Dividend Calendar for the entire portfolio to assist with planning purposes).
ETF Sector Rotation System – The System closed all 5 positions on Sep 30 and Bought SPY QQQ SLV EEM & EFA on Oct 1, 2020 (20% into each).
Long Term Strategy for IRAs & 401k Plans
Alert! Market Risk is MEDIUM (Yellow Zone). The probability of successful Short Term Trades is better, when the % of stocks above the 50-day avg. is below 20.
Tell your Friends about the Green Line, and Help Animals
___________________________________________________________________________________________
QUESTION: Omar writes” Hello guys. I am new to your website and want to know where can I get analysis for special stock or commodity.
And I want to know how to follow your trades. I can find existing positions and swing trades.”
ANSWER: HI Omar. Here is a link to learn about most investment positions:
Here is Link for My Dashboard, another video for using Daily emails: https://youtu.be/v_Uy6jh2r24
And the Rules.
Good trading and tell your friends!
AGL


