
5/15/2022 Markets were lower again on a wild week of volatility. Most of the longer term indicators are now very over-sold, which means that Smart Money should be accumulating Stocks from the Dumb Money that bought Way Above the Green Lines in January.
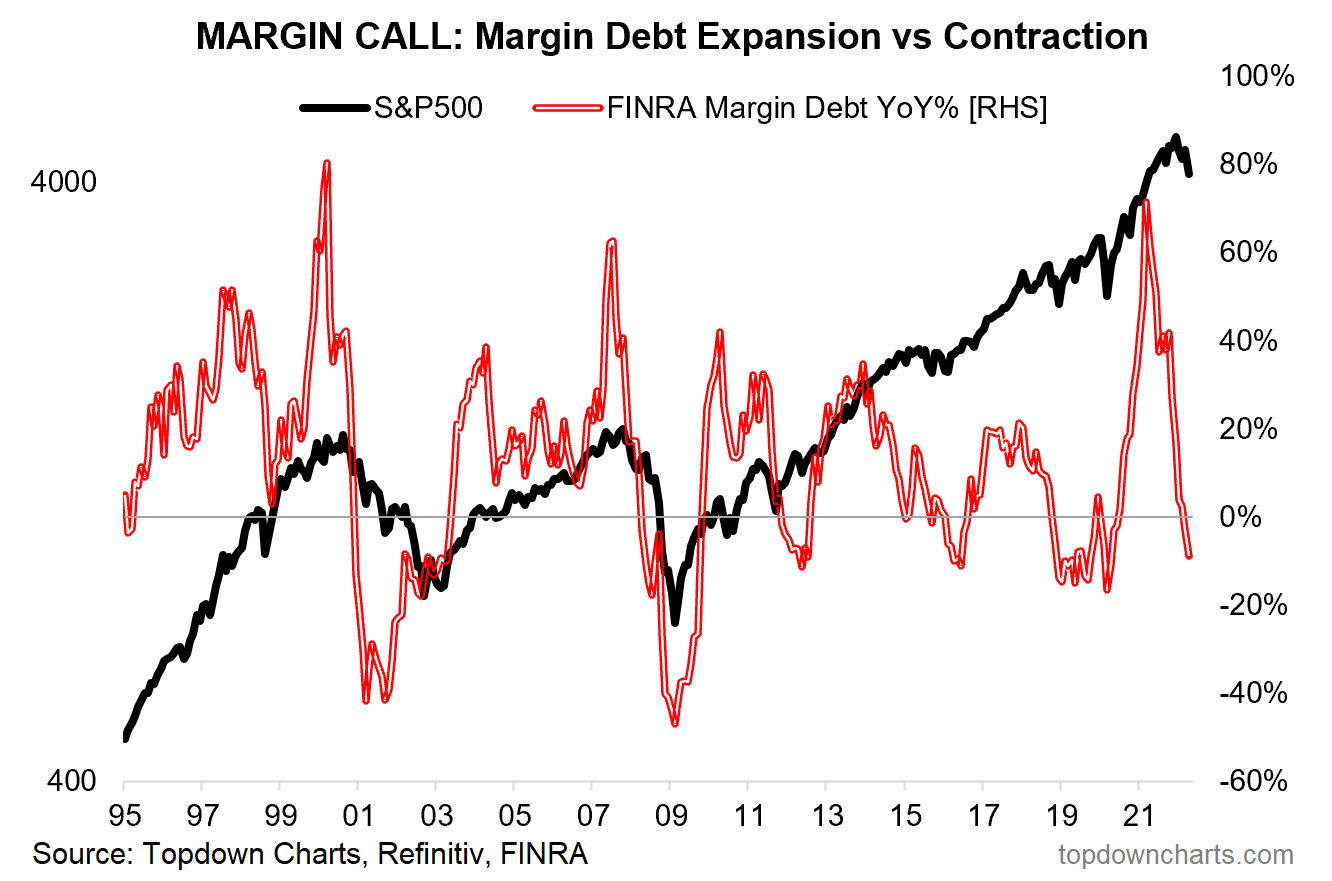
Dumb Money was so confident and greedy near the Top (they panic bought Way Above the Green Lines), that they also bought with borrowed money on Margin. Margin can be very dangerous if your investment falls in value, because you can get squeezed out and have to Sell near the bottom.
This could explain why some stocks have dropped so much in the last year. Once the Margin Calls (forced selling) are met, the big Flush could be over for a while. Then the major Indices should be able to return back up near the Green Lines. After that, we will have to wait and see.
Presently 68% of all Investments are below the 1 year average, and that is when Bad things happen. But the FEAR levels are the highest in 2 years, which normally indicates a big rally should happen on Good News. Then Conservative investors should probably raise Cash, or only own Investments that are Above the Green Lines.
Currently the tangible Commodities are Way Above the Green Lines, and Bonds are Way Below the Green Lines. Both will eventually return to the Green Lines, so maybe we will see a Stock Market rally when Interest Rates and Inflation fall. (Big surprise for Dumb Money.)
If you continue to Follow the Green Line System, your Money should flow into the Strongest areas and your account value should be able to grow in both Bull and Bear Markets.
More action this week on the Day Trading Scrolling Charts.
DAY TRADING CHARTS FOR INDICES & LARGE CAPS.
We have not had many intra-day Trade Alert signals lately as the Volume has been too Low with the Buy Signals. These low Volume Buy Signals tend to pop up and quickly fade back down. We like to see High Volume on rallies.
For the week the Dow was down 2.08%, the S&P 500 was down 2.34%, and the NASDAQ 100 was down 2.36%. The Long Term Trend for the Indices is up.
The Inflation Index (CRB) was down 0.88% for the week and is Above the Green Line, indicating Economic Expansion.
Bonds were up 2.03% for the week, and are Way Below the Green Line, indicating Economic Expansion.
The US DOLLAR was up 0.89% for the week and is Way Above the Green Line.
Crude Oil was up 0.66% for the week at $110.49 and GOLD was down 3.96% at $1808.20.
_____________________________________________________________________________________________
MONEY WAVE BUYS SOON
We are in now in 8 logged Current Positions for the Short & Medium Term. There are 3 investments on the Short Term Watch List.
Be patient and WAIT for Green Zone Buy Signals!
_________________________________________________________________________________________
LONG TERM INVESTMENTS (Hard to find many Long Term now because most normal Investments no longer have 80 Relative Strength required.)
Long Term Scrolling Charts (Real Time)
AA ALCOA CORP. Wait for Weekly Money Wave Close > 20 with High Volume.
ACI ALBERTSONS CO. Wait for Weekly Money Wave Close > 20 with High Volume.
BLDR BUILDERS FIRSTSOURCE Bought when it Closed above $66.83 with High Volume. Target is $76. Sell Stop below the Green Line.
COST COSTCO WHOLESALE Wait for Weekly Money Wave Close > 20 with High Volume.
RRPIX RISING INTEREST RATES FUND Currently the Weekly Chart is in the Red Zone. Wait for the next Daily Money Wave Buy Signal.
_______________________________________________________________________________
My Trading Dashboard
Swing Trading Scrolling Charts
Day Trading Scrolling Charts
Click for Watch Lists
Click for Current Positions
Click for Closed Positions
Updated Top 100 List May 1, 2022
Dividend Growth Portfolio
Updated ETF Sector Rotation System
Dogs of the DOW System
Long Term Strategy for IRAs & 401k Plans
CNN Fear & Greed Index
Scrolling Stage Chart Investing Charts
Alert! Market Risk is LOW (GREEN). The probability of successful Short Term Trades is better, when the % of stocks above the 50-day avg. is below 20.
Tell your Friends about the Green Line, and Help Animals.
________________________________________________________________________________
QUESTION: Praveen wrote “Hello ATGL. I am not receiving alerts for the buy and sell I am just getting end of day link. can you please fix my problem. Thanks,
ANSWER: Hi Praveen. We currently have 1 email going out Daily, the Money Wave Avert! which is sent between 3:40 -3:50 EST.
We have not had many intra-day Trade Alert Signals lately as the Volume has been too Low with the Buy Signals. These low Volume Buy Signals tend to pop up and quickly fade back down. We like to see High Volume on rallies.
Most members follow the Watch List and My Trading Dashboard during the day, as they are constantly being updated.
We also have Live Streaming on YouTube, which has these current Watch Lists running “real time”.
Thank you for writing,
ATGL
