
NEW: Many have asked for trading on the Major Indices, so we have Lowered the Relative Strength requirement on Major Indices and Stocks > $100 Billion of Market Cap to 80 R S.
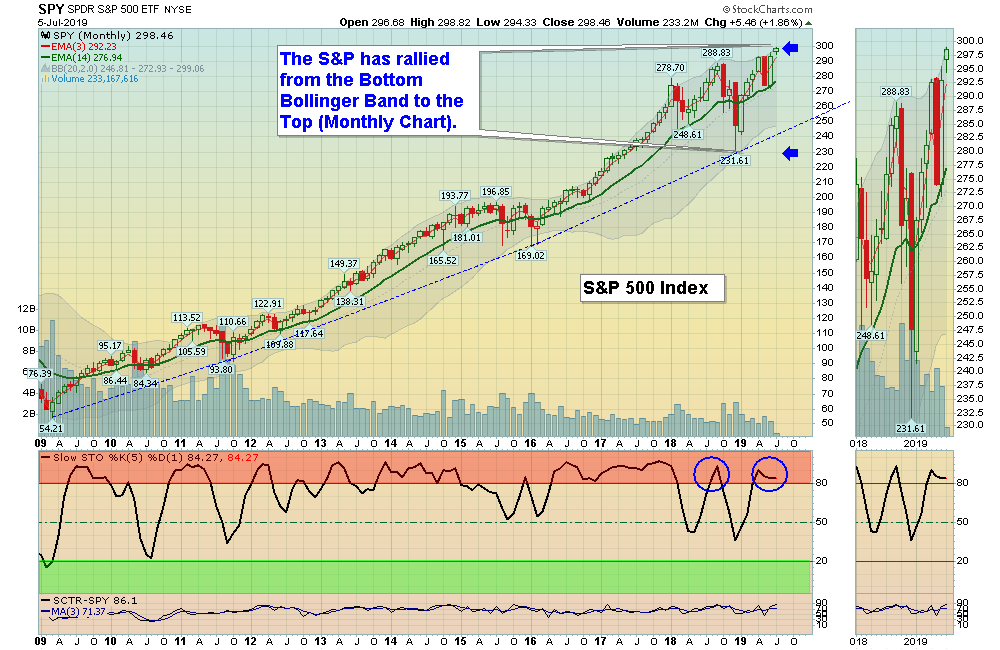
07/07/2019: Markets were up for the week, after Investors received Good News about China Trade on Monday, The S&P 500 Index and DOW INDEX were able to make new Highs, but with the lower Holiday Volume, it does not mean much yet.
Next, most are waiting for more FED Printing to stimulate the Economy. The Fed Futures are pointing to an 80% chance of a July Rate cut, but not until the meeting at end of July. Currently most Leading Investments are in the Red Zones (probably too late to Buy for the Short Term) so maybe some profit taking soon on the Good News.
Bonds are Way Above the Green Line, and new signs of Economic strength should cause Bonds to drop.
For the week the Dow was up 1.21%, the S&P 500 was up 1.65%, and the Nasdaq 100 was up 2.31%. The Long Term Trend on the Stock Markets is UP.
The Inflation Index (CRB) was down 0.14% and is Below the Green Line, indicating Economic Weakness.
Bonds were down 0.09% for the week and are Way Above the Green Line, indicating Economic Weakness.
The US DOLLAR was up 1.19% as it was over-sold and in the Green Zone. It could be having a huge Double Top from 3 years ago.
Crude Oil was down 1.64% for the week at $57.51, and GOLD was down 0.96% at $1400.10.
___________________________________________________________________________________________
MONEY WAVE BUYS SOON:
We are currently in 9 logged Open Positions, for the Short & Medium Term. There are 2 Investments on the Short Term Watch List.
Be patient and WAIT for Green Zone Buy Signals!
______________________________________________________________________________________________
LONG TERM INVESTMENTS
Buy the Leading Investments that are down near the weekly Green Zones.
HZNP HORIZON PHARM. Wait for Weekly Close Above the Red Line of $24.66.
IONS IONIS PHARM. Wait for Weekly Close Above the Red Line of $66.75.
LLY ELI LILLY & CO. Wait for Weekly Close Above the Red Line of $115.69.
RAMP LIVE RAMP HOLDINGS Wait for Weekly Close Above the Red Line of $51.62.
VMW VMWARE INC. Wait for Weekly Close Above the Red Line of $178.61.
___________________________________________________________________________________________
Click for Portfolio (Open Positions)
Click for Watch List
Click for Closed Positions
Alert! Market Risk is HIGH (Red Zone). The probability of successful Short Term Trades is better, when the % of stocks above the 50-day avg. is below 20.
Tell your Friends about the Green Line, and Help Animals
___________________________________________________________________________________________
4 Ways to Get your Daily Money Wave Alert:
- Emailed to your box between 3:30 3:50 pm EDT.
- Website menu Commentary/Buy/Sell Signals
- Twitter notifications are the fastest and most reliable @AboveGreenLine
- Text messages: Email us your Cell number & phone carrier.


