Above the Green Line -01
  • Market Insights
        • Commentary
          • Daily
          • Weekly
        • BUY / SELL SIGNALS
          • Trade Posts
          • Recent Trade Alerts
          • Recent Day Trades
        • BLOGROLL
          • Dividend Growth Blog
          • ETF Sector Blog
          • Dow Dogs
          • TPOW Blog
  • Strategies
        • SWING TRADING
          • Current Positions
          • Watchlists
          • Closed Positions
          • Candidates - TOP 100
          • Specialty Stocks
        • WEEKLY STOCK PICK
          • TPOW Charts
          • TPOW Performance
          • TPOW Strategy Guide
          • TPOW Performance Dashboard
        • DAY TRADING
          • Watch List
        • ATGL DASHBOARD
        • ETF STRATEGIES
          • ETF Sector Rotation
          • ETF Sector Portfolio
        • DIVIDEND GROWTH
          • Dividend Growth Portfolio
          • Dividend Calendar
        • DOGS OF THE DOW
          • Dogs of the Dow Portfolio
          • DOW 5 Portfolio
  • Markets
        • US MARKET
          • Commodities
          • Energy
          • Precious Metals
          • Volatility
        • GLOBAL MARKETS
          • Market Indices
          • Economic Calendar
          • FOREX Heat Map
          • FOREX Cross Rates
          • Crypto Currency Market
  • Investing
    • Discord Community
    • Dashboard
  • Resources
        • ARTICLES
          • Dividend Growth Model Articles
          • ETF Articles
          • Investment Strategies Articles
          • Market and Economic Insights
          • Stock Trade Articles
          • Stock Reviews
        • TOOLS
          • Stock Scanners
          • Charting Software
          • Brokerage Firms
        • STOCK CHARTS
          • Key Components
          • Reading Charts
          • Drawing Stock Charts
          • Identifying Trends
        • RETIREMENT PLANNING
  • About
    • Contact Us
    • How to Win
    • #1 At Stockcharts
    • Disclaimer
    • FAQ
  • Log In
  • Subscribe

July 19, 2020

Green Line Weekly Jul 19, 2020

SPY Chart
The weekly S&P 500 Index.

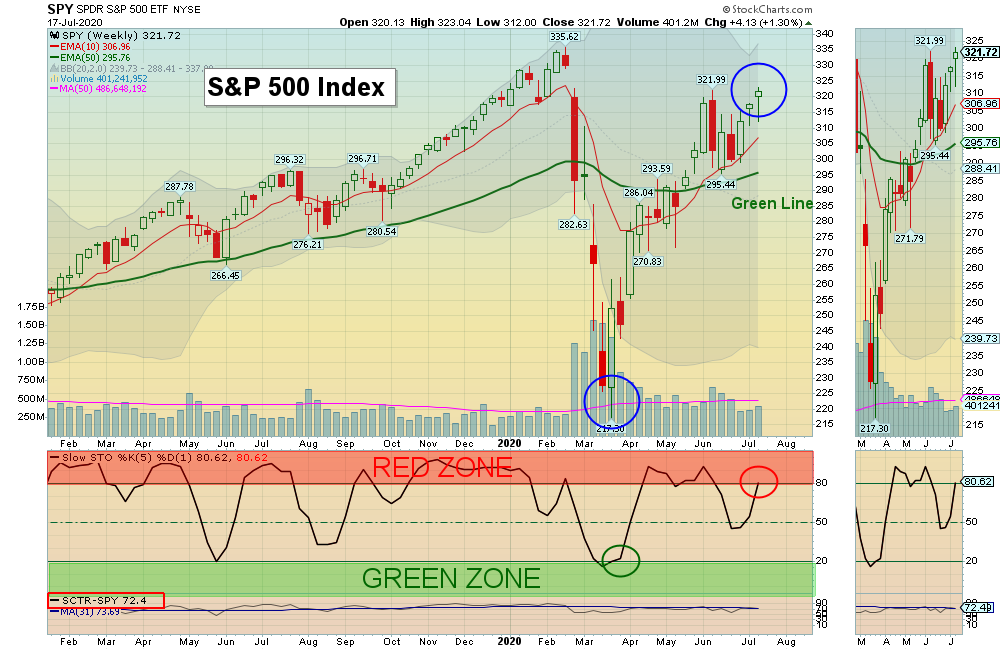
07/19/2020 Markets were up again for the week as the S&P 500 Index is well into a “W” pattern off the Red Line (50-day avg.), and it made it back up to the June Highs. Now the S&P 500 needs to exceed the June Highs for this rally up to continue. The CNN Fear & Greed Index is back up to 63. Inflation could be starting up as Silver and Copper are close to breaking out, along with Gold.

The very Strongest Leaders had some mild profit taking this week, but will normally go up again until they Double Top or Fail to make Higher Highs. A Double Top would tell us that there is a lack of Buyers Way Above the Green Line. Then they would normally pull back down near the Red Lines (50-day averages) like they always do. Most Investors don’t have the patience or discipline to WAIT for AAPL ADBE AMZN DOCU NFLX NVDA PYPL QQQ SHOP TSLA TWLO & ZS to correct back down to the Green Zones.

We will WAIT on the Leaders to pull-back instead of buying weaker Investments, even if they meet the Green Line Rules.

The Watch List  is growing with Leaders as they return to the Green Zones for Money Wave Buy Signals.

For the week the Dow was up 2.35%, the S&P 500 was up 1.30%, and the Nasdaq 100 was down 1.72%. The Long Term Trend for the Indices is up. 

The Inflation Index (CRB) was down 0.49% and is Below the Green Line, indicating Economic Weakness.

Bonds  were up 0.27% for the week and are Above the Green Line, indicating Economic Weakness.

The US DOLLAR was down 0.69 % for the week and is Below the Green Line. 

Crude Oil was up 0.49% for the week at $40.75 and GOLD was up 0.45%  at $1810.00, a New High.

_____________________________________________________________________________________________

MONEY WAVE BUYS SOON

We are currently in 1 logged Current Positions, for the Short & Medium Term.  There are 12 Investments on the Short Term Watch List. 

Be patient and WAIT for Green Zone Buy Signals!

______________________________________________________________________________________________

LONG TERM INVESTMENTS  (Most of the Leaders are back up in the Weekly Red Zones.)

Buy the Leading Investments that are down near the Weekly Green Zones.     

AUY      YAMANA GOLD      Buy if it Closes above $5.73 on High Volume.  All time High is $18.50.     

GPRO     GOPRO INC.      Buy if it Closes above $5.79 on High Volume.  All time High s $98.00.

IOVA     IOVANCE BIO.      Wait for the next Daily Money Wave Buy. 

KIRK     KIRKLAND’S INC.      Wait for the next Daily Money Wave Buy. All time High s $29.50.

NG        NOVA GOLD RESOURCES      Buy if it Closes above the Red Line on High Volume.  All time High s $16.00.     

RRC     RANGE RESOURCES CORP.       Buy if it Closes above $7.14 on High Volume. All time High is $92.45.  

______________________________________________________________________________________

Click for  Current Positions
Click for  Watch List
Click for  Closed Positions

NEW PENNY STOCK WATCH LIST

Day Trade List June 27, 2020

TOP 100 LIST JUL 2, 2020

Dividend Growth Portfolio  (we are now posting a Dividend Calendar for the entire portfolio to assist with planning purposes).

ETF Sector Rotation System –  New Quarterly Rotation was on June 30 & July 1, 2020.

Dogs of the DOW System

Long Term Strategy for IRAs & 401k Plans

CNN Fear & Greed Index

Alert! Market Risk is HIGH (Red Zone). The probability of successful Short Term Trades is better, when the % of stocks above the 50-day avg. is below 20. 

Tell your Friends about the Green Line, and Help Animals

___________________________________________________________________________________________

QUESTION:  Alberto writes “AGL:   Little question: what does the green dot on the portfolios holdings mean? Thank you.”

ANSWER:  Hi Roberto, please click on the Symbol Link for a Daily Chart, and on the Green Dot to see the 60-min Chart of the Investment.

Good trading, and tell your friends!

AGL

Related Post

– Green Line Weekly Jul 12, 2020

Subscribe to Our Newsletter

AGL Logo

Get our eBook Now!

Candlestick - A Swing Traders Friend

We don’t spam! Read our privacy policy for more info.

Check your inbox or spam folder to confirm your subscription.

Voted #1 at Stock Charts

SH Chart
Inverse S&P 500 Fund (SH) will have a Money Wave Buy today.

Help Us Help Animals

Help Us Help Animals

Recent Comments

  • ATGL Weekly Money Flow - 2025-05-11 on ATGL Top Pick of the Week! Apr 6, 2025
  • ATGL Weekly Money Flow - 2024-06-19 on Day Trading vs Swing Trading: Which One Is More Worth It?
  • AbovetheGreenLine on Green Line Weekly Aug 27, 2023
  • lbrodt on Green Line Weekly Aug 27, 2023
  • Mitch Van Zelfden on Money Wave Alert! Jul 31, 2023

Become a Green Liner!

Help me make more Money in the Stock Market.

ON ATGL

  • DashBoard
  • Weekly Commentary
  • Daily Buy / Sell Signals
  • Day Trade Setup
  • Trading Rooms

Design & Develop By Pixelvect

STRATEGIES

  • Swing Trading
  • ATGL Pick of the Week
  • Dividend Growth
  • ETF Sector Rotation
  • Dogs of the Dow

HELP

  • ATGL Trading Rules
  • FAQ
  • Account Maintenance
  • Contact US
  • Join

FOLLOW US

Instagram Linkedin Twitter Facebook

© COPYRIGHT 2024 · ABOVETHEGREENLINE.COM · ALL RIGHTS RESERVED · PRIVACY · TERMS · CONTACT · WATCHLIST · CURRENT