
7/16/2023 Markets were higher for the week as Commodity prices have dropped which has caused the Inflation Rate to drop. The strongest Indices and Leaders were able to exceed the recent highs, and negate the possible “M” or Double Top pattern. Markets are moving up on the hope that Inflation has peaked and that the FED will Stop Tightening (raising short term (interest Rates).
The FED has been Printing again since March when the Bank Term Funding Program (BTFP) was implemented. This Printing is helping push up Stocks with liquidity. Also some sectors of the Economy are benefitting from the $1.7 TRILLION spending package by Congress late last year.
But high Interest Rates have weakened Commodity prices world wide. Commodity prices are historically a good indication of Economic strength. So the Markets are conflicted, but currently Fed Printing is winning.
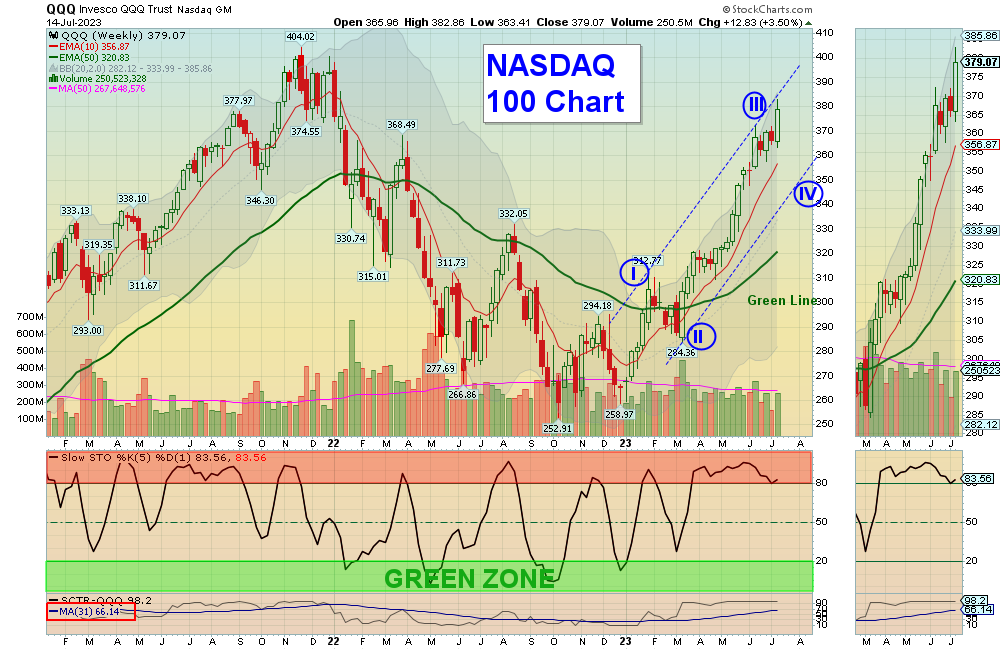
The NASDAQ 100 Fund is still going up on Wave 3 up , then it should a 38% correction down near the 50-day avg. (count of 345). Greed and FOMO (Fear of Missing Out) have taken over, so normally there will be some profit taking soon. Currently the CNN Fear & Greed Index up at 80, the Greed Index (SVXY), and the Fear Index (VIX) are all telling Smart Money to take profits and Raise CASH.
If you continue to Follow the Green Line System, your Money should flow into the Strongest areas and your account value should be able to grow in both Bull and Bear Markets. Follow the MONEY, not the MEDIA.
_____________________________________________________________________________________________
For the week the Dow was up 2.29%, the S&P 500 was up 2.45% and the NASDAQ 100 was up 3.50%. Many of the major Indices still have a Relative Strength below 80, so you should currently own the stronger Funds here.
The Inflation Index (CRB) was up 2.29% for the week and is Above the Green Line, indicating Economic Expansion.
Bonds were up 2.23% for the week, and are Below the Green Line, indicating Economic Expansion.
The US DOLLAR was down 2.30% for the week and is Below the Green Line.
Crude Oil was up 2.11% for the week at $75.42 and GOLD was up 1.65% at $1964.40.
_____________________________________________________________________________________
We are now doing micro Day Trades on our new Discord site (free). Please join Discord on your cell phone app for mobile notifications during the day. Other methods of notification have been too slow. Also, please check our our Live Streaming on YouTube during Market hours.
More action this week on the Day Trading Scrolling Charts, and DAY TRADING CHARTS FOR INDICES & LARGE CAPS.
_____________________________________________________________________________________________
MONEY BUYS SOON:
We are in now in 6 logged Swing Trading Positions for the Short & Medium Term. There are 4 investments on the Short Term Watch List.
Be patient and WAIT for Green Zone Buy Signals!
LONG TERM INVESTMENTS:
Long Term Scrolling Charts (Real Time)
ASRT ASSERTIO HOLDINGS Wait for Weekly Money Wave Close > 20 with High Volume.
EDU ORIENTAL EDUCATION GROUP Buy above $46.63 with High Volume with a 3% Trailing Sell Stop Loss below it.
MGNI MAGNITE INC. Wait for Daily Money Wave Close > 20 with High Volume.
PINS PINTEREST INC. Buy above $29.27 with High Volume with a 3% Trailing Sell Stop Loss below it.
SH INVERSE S&P 500 FUND Buy above $17.71 with High Volume with a 3% Trailing Sell Stop Loss below it.
STNE STONECO LTD. Buy above $15.01 with High Volume with a 3% Trailing Sell Stop Loss below it.
TAL TAL EDUCATION GROUP Buy above $10.45 with High Volume with a 3% Trailing Sell Stop Loss below it.
VKTX VIKING THERA. INC. Wait for Weekly Money Wave Close > 20 with High Volume.
__________________________________________________________________________________________
My Trading Dashboard
Swing Trading Scrolling Charts
Day Trading Scrolling Charts
Click for Watch Lists
Click for Current Positions
Click for Closed Positions
Updated Top 100 List Jul 1, 2023
Dividend Growth Portfolio
Updated ETF Sector Rotation System
Dogs of the DOW System
Long Term Strategy for IRAs & 401k Plans
CNN Fear & Greed Index
Scrolling Stage Chart Investing Charts
Alert! Market Risk is High (RED). The probability of successful Short Term Trades is better, when the % of stocks above the 50-day avg. is below 20.
Tell your Friends about the Green Line, and Help Animals.
________________________________________________________________________________
QUESTION: Steve V. writes “Do you do both long and short positions or does someone just invert the rules in a down market?”
ANSWER: Yes, invert the Rules to Sell Short (Below G L, Below 10 R S, Dropping below 80 on Money Wave).
We will wait until the Market is in a Bear (below the Green Line), and not Short the next Correction back down to Green Line.
Once the Market is in BEAR, we will manly do Inverse Funds, as most don’t understand Shorting…
The Leaders should have nice pops back up once they correct back down near the Green Lines. We don’t like to Sail into the Wind (FED Printing).
Good trading and tell your friends!
ATGL
