
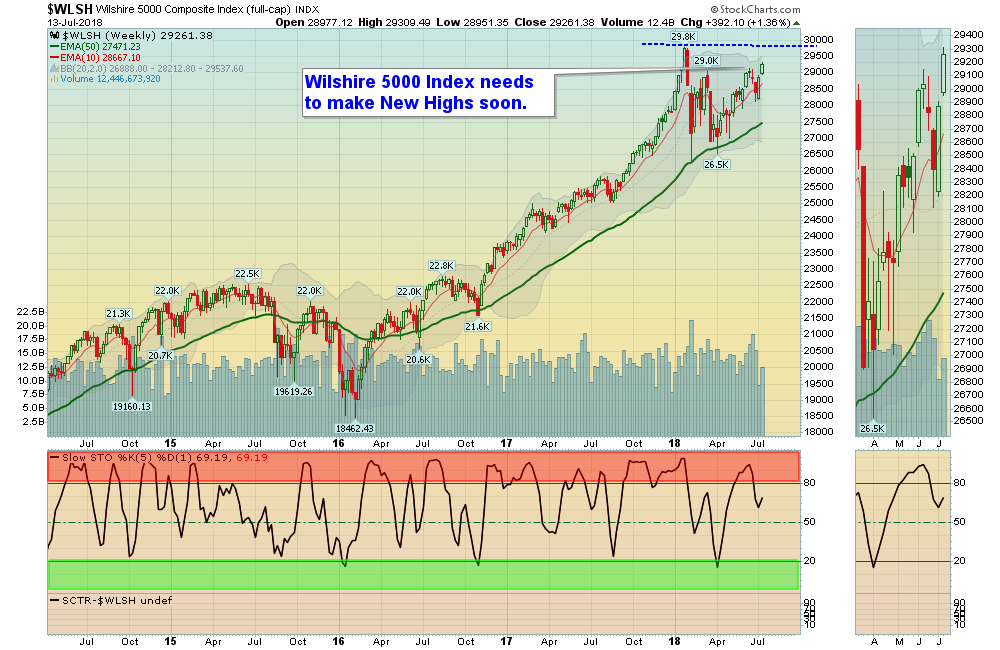
07/15/2018: Markets were up for the week, as the Indices are going back up to re-test the January Highs. Failure of the broad Markets to push higher could indicate a lack of money for Stocks. Stock now have competition from higher Interest Rates and Commodity prices.
The NASDAQ 100 Index was able to get back up to the Highs on Friday with 3 of the 5 FAANG stocks leading. For the week, the Dow rose 2.29%, 1.79% for the Nasdaq and 1.51% for the S&P 500. The Long Term Trend on the Stock Markets is UP.
The Inflation Index (CRB) was down 2.18% and is struggling to hold Above the Green Line.
Bonds were mixed for the week but the weekly Money Wave is in the Red Zone. This could be forecasting Economic weakness.
The US DOLLAR was able to bounce up off the Red Line (50-day avg.)
Crude Oil was down 3.78% for the week at $71.01, and GOLD was down 1.16%.
___________________________________________________________________________________________
MONEY WAVE BUYS SOON:
We are currently in 4 logged Open Positions, for the Short & Medium Term. Most are now in the Yellow or Red Zones, so please have Sell Stops below them. There are 5 Investments on the Short Term Watch List.
Be patient and WAIT for Green Zone Buys!
______________________________________________________________________________________________
LONG TERM TRADES
The Funds below are correcting down to their Green Lines, but the Relative Strength is remaining high. These tend to Bounce nicely when the weekly Money Wave crosses up > 20.
FCAU FIAT CHRYSLER Wait for weekly Close Above the Red Line of $20.44 (50-day avg.)
IBKR INTERACTIVE BROKERS Wait for Weekly Money Wave Close > 20.
INTC INTEL CORP. Wait for weekly Close Above the Red Line of $52.54 (50-day avg.)
IOVA IOVANCE BIOTHERA. Wait for Daily Close Above $14.10.
SCCO SOUTHERN COPPER Wait for weekly Close Above the Red Line of $48.23 (50-day avg.)
SPLK SPLUNK INC. Wait for weekly Close Above the Red Line of $106.61 (50-day avg.)
VALE VALE DO RIO Wait for weekly Close Above the Red Line of $13.31 (50-day avg.)
VLO VALERO ENERGY Wait for Weekly Money Wave Close > 20.
___________________________________________________________________________________________
Click for Portfolio (Open Positions)
Click for Watch List
Click for Closed Positions
Alert! Market Risk is High (RedZone). The probability of successful Short Term Trades is better, when the S&P 500 is down near the Green Line.
Tell your Friends about the Green Line, and Help Animals.
QUESTION: Ray H. writes” How do I find a chart on Portfolio stocks? Thanks.”
ANSWER: Hi Ray. Please click on the Portfolio Link of each email.
The click on the Green Symbol (ex. URBN for Daily Chart) , and Green Round Circle (for 60-min Chart).
Good trading, and tell your friends!


