
1/2/2022 Markets were higher again for the week, as the Indices continued the bounce up out of the Green Zones from last week’s Low. Now the Indices need to make Higher Highs for the rally to continue. The S&P 500 Index was able to make a New High, but the other Indices did not. We should find out soon if the Markets can go higher without the FED propping it up, like they have done for many years.
Now that the End of the Year Tax Loss Selling on the Small Caps ended on Friday, maybe the Money will rotate back into the Small Caps again.
If you continue to Follow the Green Line System, your Money should flow into the Strongest areas and your account value should be able to grow in both Bull and Bear Markets.
The five ETF positions were sold on the Close Friday in the ETF Sector Rotation System. Please allocate 20% of the Funds into these five funds: SPY QQQ XLF XLE and XLV on the Close Monday, Jan. 3, 2022.
There has been plenty of action on the Day Trading Scrolling Charts.
NEW! DAY TRADING CHARTS FOR INDICES & LARGE CAPS.
We have not had many intra-day Stocks Alerts lately as the Volume has been too Low on Buy Signals. We like to see High Volume on rallies.
For the week the Dow was up 1.10%, the S&P 500 was up 0.93%, and the NASDAQ 100 was up 0.23%. The Long Term Trend for the Indices is up.
The Inflation Index (CRB) was up 0.64% for the week and is Above the Green Line, indicating Economic Expansion.
Bonds were down 0.22% for the week, but are back Above the Green Line, indicating Economic Contraction.
The US DOLLAR was down 0.41% for the week and is Above the Green Line.
Crude Oil was up 1.92% for the week at $75.21, and GOLD was up 0.93% at $1828.60.
_____________________________________________________________________________________________
MONEY WAVE BUYS SOON
We are currently in 6 logged Current Positions, for the Short & Medium Term. There are 4 investments on the Short Term Watch List.
Be patient and WAIT for Green Zone Buy Signals!
_________________________________________________________________________________________
LONG TERM INVESTMENTS (many Large Caps no longer have 80 Relative Strength required.)
Long Term Scrolling Charts (Real Time)
BTU PEABODY ENERY CORP. Buy if it Closes above $11.23 with High Volume.
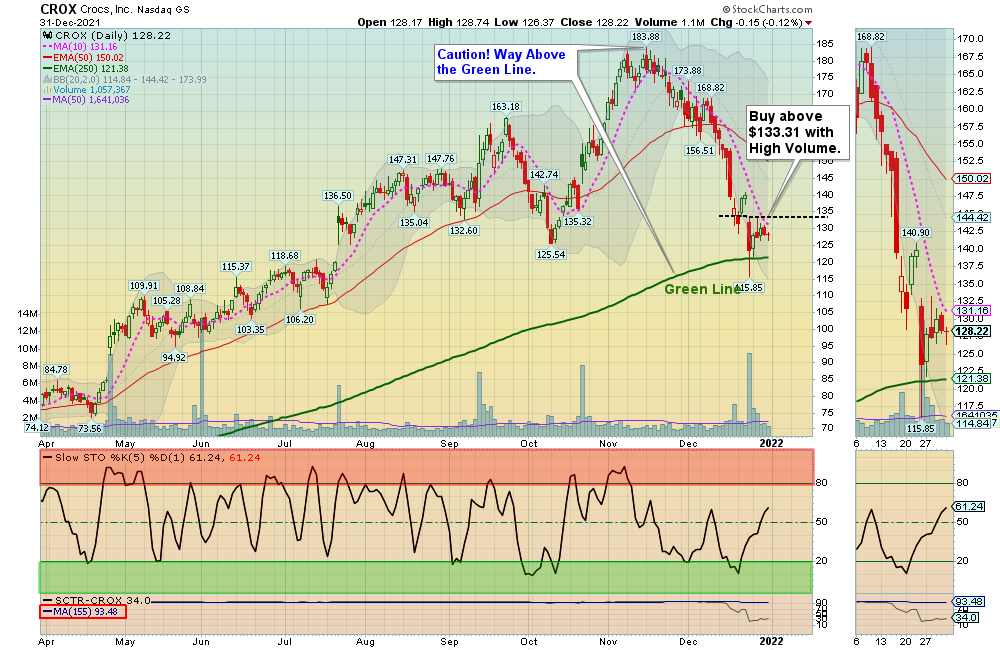
CROX CROCS INC. Buy if it Closes above $133.31 with High Volume.
DBC COMMODITY FUND Wait for the next Daily Money Wave Buy Signal.
DKS DICKS SPORTING GOODS Shot up 10.63% this week on average Volume. Wait for the next Daily Money Wave Buy Signal.
M MACY’S INC. Buy if it Closes above the Red Line (50-day avg.) with High Volume.
RRC RANGE RESOURCES CORP. Buy if it Closes above $19.44 with High Volume.
UPST UPSTART HOLDINGS Buy if it Closes above the Green Line (250-day avg.) with High Volume.
____________________________________________________________________________________
My Trading Dashboard
Swing Trading Scrolling Charts
Day Trading Scrolling Charts
Click for Watch Lists
Click for Current Positions
Click for Closed Positions
Updated Top 100 List Jan 1, 2022
Dividend Growth Portfolio
ETF Sector Rotation System
Dogs of the DOW System
Long Term Strategy for IRAs & 401k Plans
CNN Fear & Greed Index
Scrolling Stage Chart Investing Charts
Alert! Market Risk is MEDIUM (Yellow Zone). The probability of successful Short Term Trades is better, when the % of stocks above the 50-day avg. is below 20.
Tell your Friends about the Green Line, and Help Animals.
______________________________________________________________________________________
4 Ways to Get your Daily Money Wave Alert:
-
- Emailed to your box between 3:40 3:50 pm EST.
- Website menu Commentary/Buy/Sell Signals
- Twitter notifications are the fastest @AboveGreenLine
- Text messages: Email us your Cell number & phone carrier.
Thank you,
ATGL


