
01/19/2020: Markets were up big again for the week to New Highs. The Markets are curving up and melting up. Now there are four Trillion Dollar Companies (Apple, Google, Amazon, and Microsoft) which accounted for much of the advance.
Currently the Indices are Way Above the Green Lines, and the CNN Greed Index slipped back to 89.
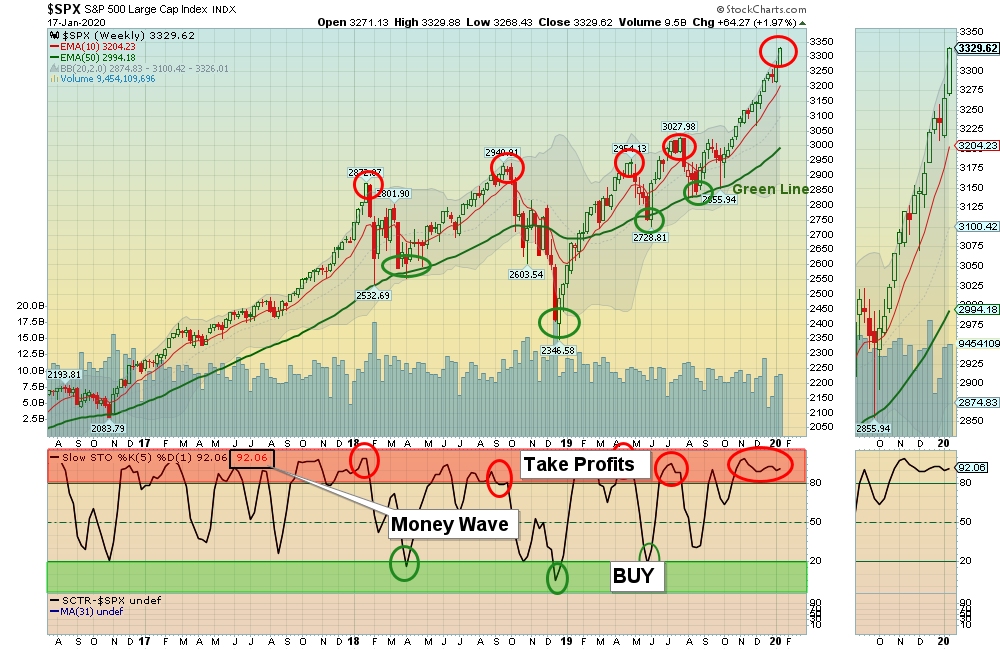
New Subscribers: It is unusual that the Leaders and stronger Indices have not returned down to the Green Zones since October (usually it is every 1-2 months). Please be patient and realize that the rally since October has not corrected enough to create many good Money Wave Buys. This will change.
Shorter Term Traders should raise Cash and WAIT for the S&P 500 Index and the Leaders to return to their Green Zones for Money Wave Buy Signals.
For the week the Dow was up 1.79%, the S&P 500 was up 1.92%, and the Nasdaq 100 was up 2.27%. The Long Term Trend on the Stock Markets is UP.
The Inflation Index (CRB) was down 0.68% and is Above the Green Line, indicating Economic Strength.
Bonds were down 0.30% for the week and are Above the Green Line, indicating Economic Weakness.
The US DOLLAR was up 0.38% for the week.
Crude Oil was down 0.78% for the week at $58.58, and GOLD was up 0.01% at $1560.30.
_____________________________________________________________________________________________
MONEY WAVE BUYS SOON:
We are currently in 2 logged Open Positions, for the Short & Medium Term. There are 3 Investments on the Short Term Watch List.
Be patient and WAIT for Green Zone Buy Signals!
______________________________________________________________________________________________
LONG TERM INVESTMENTS
Buy the Leading Investments that are down near the weekly Green Zones.
CPG CENTER POINT ENERGY Buy if it Closes above $4.84 on High Volume.
GE GENERAL ELECTRIC CORP. Relative Strength is Below 80 needed for Large Caps. Wait for next Daily Money Wave Buy Signal.
NWL NEWELL BRANDS Buy if it Closes above $20.84 on High Volume.
PLG PLATINUM GROUP Wait for the next Daily Money Wave Buy Signal.
RAD RITE AID CORP. Struggling to hold Above the Green Line. WAIT .
______________________________________________________________________________________
Click for Portfolio (Open Positions)
Click for Watch List
Click for Closed Positions
Long Term Strategy for IRAs & 401k Plans: Currently invested in all 4 Funds.
Alert! Market Risk is HIGH (Red Zone). The probability of successful Short Term Trades is better, when the % of stocks above the 50-day avg. is below 20.
Tell your Friends about the Green Line, and Help Animals
___________________________________________________________________________________________
QUESTION: Stan writes ” Do you ever Sell Investments Short?”
ANSWER: Hi Stan, as long at the major Indices are in up-trends we will not Short, as most Followers don’t understand Selling Short. We will use Inverse Funds when they meet the Green Line Rules.


