
12/18/2022 Markets were lower again for the week as the major Indices are correcting the 19% rally up from the Oct. lows. Also the Markets are telling the Fed to stop tightening after after they raised short term Interest Rates another 1/2 point. For the Markets to go higher, the FED needs to stop tightening and talk about the end of tightening.
It has been harder to make money in this Market compared to last year. So far the Green Line System has completed 69 Swing Trades this year, with an average return of 3.45% per trade (32 of the 69 trades were losses).
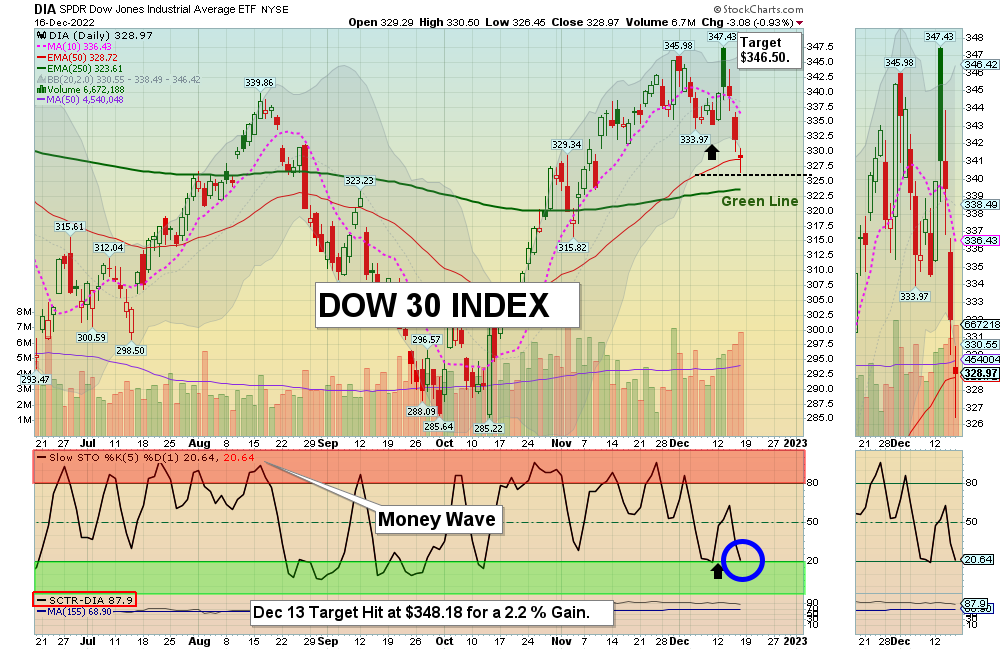
Currently the major Indices are back down in the Green Zones (probably too late to Sell for the short term), We could see a bounce up soon, and we will have a list of End of Year Tax Selling bargains soon. The Strongest Index is the Dow 30 (DIA), also big Pharma and Energy.
If you continue to Follow the Green Line System, your Money should flow into the Strongest areas and your account value should be able to grow in both Bull and Bear Markets. Follow the MONEY, not the MEDIA.
________________________________________________________________________________________________________________________________________________
For the week the Dow was down 1.69%, the S&P 500 was down 2.10% and the NASDAQ 100 was down 2.69%. Most of the major Indices do not have Relative Strength above 80, so you should currently own the stronger Securities here.
The Inflation Index (CRB) was up 1.92% for the week and is Below the Green Line, indicating Economic Contraction.
Bonds were up 0.98 % for the week, and are Below the Green Line, indicating Economic Expansion.
The US DOLLAR was down 0.13% for the week and is down near the Green Line.
Crude Oil was up 4.84% for the week at $74.46 and GOLD was down 0.58% at $1800.20.
More action this week on the Day Trading Scrolling Charts.
DAY TRADING CHARTS FOR INDICES & LARGE CAPS.
We have not had many intra-day Trade Alert signals lately as the Volume has been too Low with the Buy Signals. These low Volume Buy Signals tend to pop up and quickly fade back down. We like to see High Volume on rallies.
_____________________________________________________________________________________________
MONEY WAVE BUYS SOON:
We are in now in 5 logged Current Positions for the Short & Medium Term. There are 7 investments on the Short Term Watch List.
Be patient and WAIT for Green Zone Buy Signals!
LONG TERM INVESTMENTS: (It is still hard to find many Long Term now because most normal Investments no longer have 80 Relative Strength required.)
Long Term Scrolling Charts (Real Time)
COP CONOCO PHILLIPS Wait for the next Weekly Money Wave Buy Signal.
CROX CROX INC. Wait for the next Daily Money Wave Buy Signal.
SH INVERSE S&P 500 FUND Buy above $17.71 with High Volume with a 3% Trailing Sell Stop Loss below it.
TBF INVERSE T-BOND FUND Wait for the next Weekly Money Wave Buy Signal.
UUP US DOLLAR FUND Wait for the next Weekly Money Wave Buy Signal.
VIPS VIPSHOP HOLDINGS Adjusted Break Out to above $11.97. Buy on the next Daily Money Wave Buy Signal.
______________________________________________________________________________________________________
My Trading Dashboard
Swing Trading Scrolling Charts
Day Trading Scrolling Charts
Click for Watch Lists
Click for Current Positions
Click for Closed Positions
Updated Top 100 List Dec 1, 2022
Dividend Growth Portfolio
Updated ETF Sector Rotation System
Dogs of the DOW System
Long Term Strategy for IRAs & 401k Plans
CNN Fear & Greed Index
Scrolling Stage Chart Investing Charts
Alert! Market Risk is Medium (YELLOW). The probability of successful Short Term Trades is better, when the % of stocks above the 50-day avg. is below 20.
Tell your Friends about the Green Line, and Help Animals.
________________________________________________________________________________
QUESTION: John C. writes “Hi. I have been using your methods with quite good success over the past year, but lately I have been wondering something. Sometimes you post a daily chart for a company, but other times you post a weekly chart. For swing/momentum trading, which chart is best to go by, because looking at both, side to side, the Money Waves are quite different.
Many thanks, John C.
ANSWER: Hi John. The Green Line System is based on Buying the Leaders in the Green Zone, and taking Profits in the Red Zone.
The Daily Chart cycle usually takes 1-3 weeks and the Weekly Chart takes 1-3 months. If you Buy the Weekly, don’t look at the Daily, as the Daily will cycle thru many times and be confusing. Pick only 1 Time Frame, and stick with it.
Many will use a shorter term Time Frame for ENTRY only, then go back to your Main Chart decision.
Thanks for writing.
ATGL
Related Post
– COP


