Above The Green Line

  • Commentary
    • BUY / SELL SIGNALS
      • Stock Alerts
    • DIVGRO BLOG
    • ETF SECTOR BLOG
    • DOW DOGS BLOG
    • NEWS
    • STOCK IDEAS
  • Strategies
    • SWING TRADING
      • CURRENT POSITIONS
      • WATCHLISTS
      • CLOSED POSITIONS
      • CANDIDATES – TOP 100
      • SPECIALTY STOCKS
    • DAY TRADING
      • Watch List
    • DIVIDEND GROWTH
      • Dividend Growth Portfolio
      • Dividend Calendar
    • DOGS OF THE DOW
      • Dogs of the Dow Portfolio
      • DOW 5 Portfolio
    • ETF SECTOR ROTATION
      • ETF Sector Portfolio
  • Markets
    • US MARKET
      • Commodities
      • Energy
      • Precious Metals
      • Volatility
    • GLOBAL MARKETS
      • MARKET INDICES
      • ECONOMIC CALENDAR
      • FOREX HEAT MAP
      • FOREX CROSS RATES
      • CRYPTOCURRENCY MARKET
    • DASHBOARD
    • IDEAS
  • Investing
    • FORUM
  • Resources
    • ARTICLES
    • WEEKLY STOCK
    • RETIREMENT PLANNING
    • BLOGROLL
    • FAQ
  • About
    • CONTACT US
    • HOW TO WIN
    • #1 AT STOCKCHARTS
  • Log In
  • Subscribe

Competition

Stock trading competitions

Our technical analysis is a proven system. Data from Marketwatch.com says that 83 % of Mutual Funds Under Perform the Markets. That is because most fund manager try to “predict” what will happen, and they lose to the Emotions of the Markets (Fear & Greed).

Above the Green Line is a System to follow the Flow of Money. Investments that are Above the Green Line have more Buyers than Sellers. Investments that have High Relative Strength indicate that Investors want and believe in them, so they tend to move up faster.

We have Rules that require the Investments to be Above the Green Line + Above 90 Relative Strength. This normally means that the probability of success will be higher.  To beat the Markets, you must have High Probability. The System is fairly simple, but it does require you to Change your Investments when the Flow of Money Changes… We notify our premium members when to execute buy / sell signals. For a sample of our email notifications – see our prior months archives or commentary.
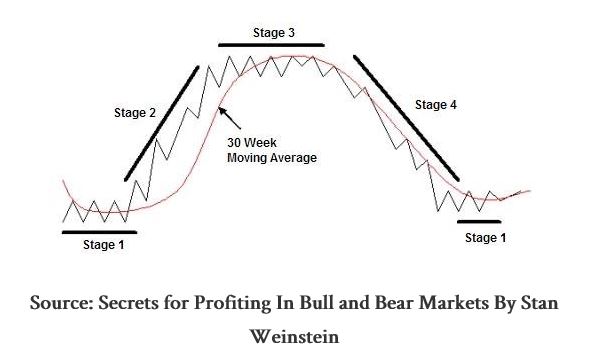
Stage Chart
Stage Chart Investing

To validate the ATGL investment strategy we Back tested using historical data for the past 10 years.

Subscribe image
Become a Green Liner.

Help me make more Money in the Stock Market.

Voted #1 at Stock Charts

SH Chart
Inverse S&P 500 Fund (SH) will have a Money Wave Buy today.

Help Us Help Animals

Help Us Help Animals

Recent Comments

  • Money Wave Alert! Mar 29, 2023 – InvFuture Education on Money Wave Alert! Mar 29, 2023
  • Money Wave Alert! Mar 28, 2023 – InvFuture Education on Money Wave Alert! Mar 28, 2023
  • Viking Thera. (VKTX) up 58% today. – InvFuture Education on Viking Thera. (VKTX) up 58% today.
  • Money Wave Alert! Mar 27, 2023 – InvFuture Education on Money Wave Alert! Mar 27, 2023
  • Green Line Weekly! Mar 26, 2023 – InvFuture Education on Green Line Weekly! Mar 26, 2023

Become a Green Liner!

Help me make more Money in the Stock Market.

Above the Green Line

ON ATGL

  • Weekly Commentary
  • Intraday Buy / Sells
  • Day Trade Setup

STRATEGIES

  • Swing Trading
  • Dividend Growth
  • ETF Sector Rotation
  • Dogs of the Dow

HELP

  • ATGL Trading Rules
  • FAQ
  • Account Maintenance
  • Contact US

© Copyright 2021 · AboveTheGreenLine.com · All Rights Reserved · Privacy · Terms · Contact · WatchList · Current