
Long Term Strategy for IRAs & 401k Plans
Long Term Strategy for IRAs and 401k Plans For very Long Term Investors, historically splitting your investment account equally into 4 Exchange Traded or Mutual Funds would grow your money faster than Inflation: 25 % S&P 500 Fund (SPY) for Growth. 25 % NASDAQ 100 Fund (QQQ) for Aggressive Growth. 25 % International Large Cap […]
Possible Stage 2 Break Outs soon.
Possible Stage 2 Break Outs soon. Investments normally cycle in 4 Stages, and after a big Bear or Down Market (Stage 4) they usually Base (Stage 1) for a year or two. A Base is a long sideways period where investors cannot decide if the fundamentals are getting better or worse. So we WAIT […]
Above the Green Line – Money Wave Buys Soon 5/9/2016 – Oclaro
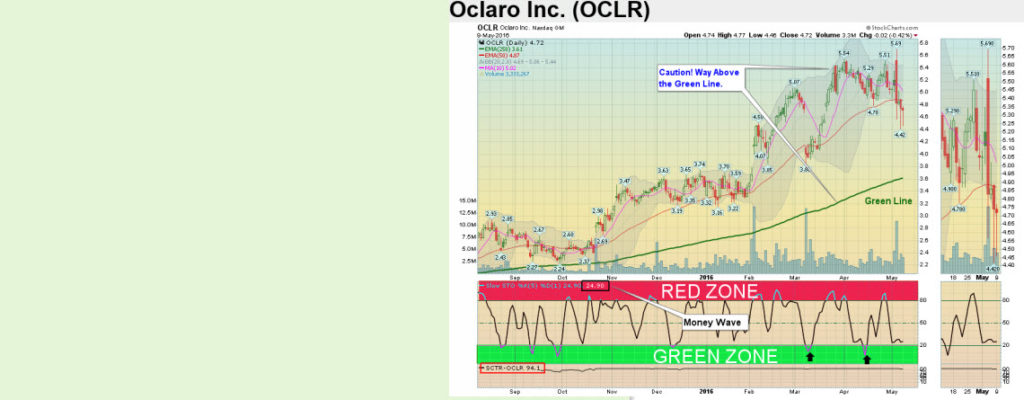
May 2 Money Wave is in the Green Buy Zone (Intra-day). Buy when Money Wave closes back above 20 for a bounce. Apr 28 Caution! Money Wave is in the Red Zone (Intra-day). Nimble Traders: Sell if it Closes below the Pink Line. Apr 25 Money Wave is > 50. Nimble traders: If it Closes […]
Above the Green Line – Money Wave Buy Soon 5/9/2016 – NVDA
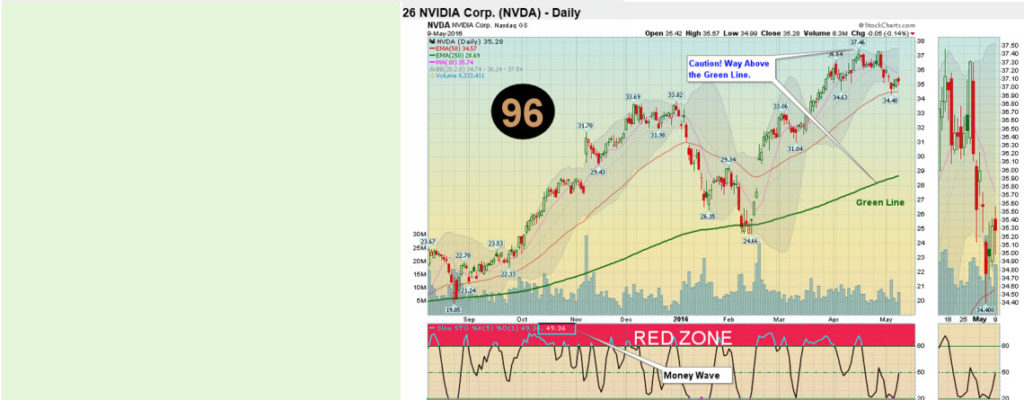
May 2 Money Wave is in the Green Buy Zone (Intra-day). Buy when Money Wave closes back above 20 for a bounce. Apr 18 Caution! Money Wave is in the Red Zone. Nimble Traders: Sell if it Closes below the Pink Line. Feb 16 Money Wave is > 50. Nimble traders: If it Closes below […]