
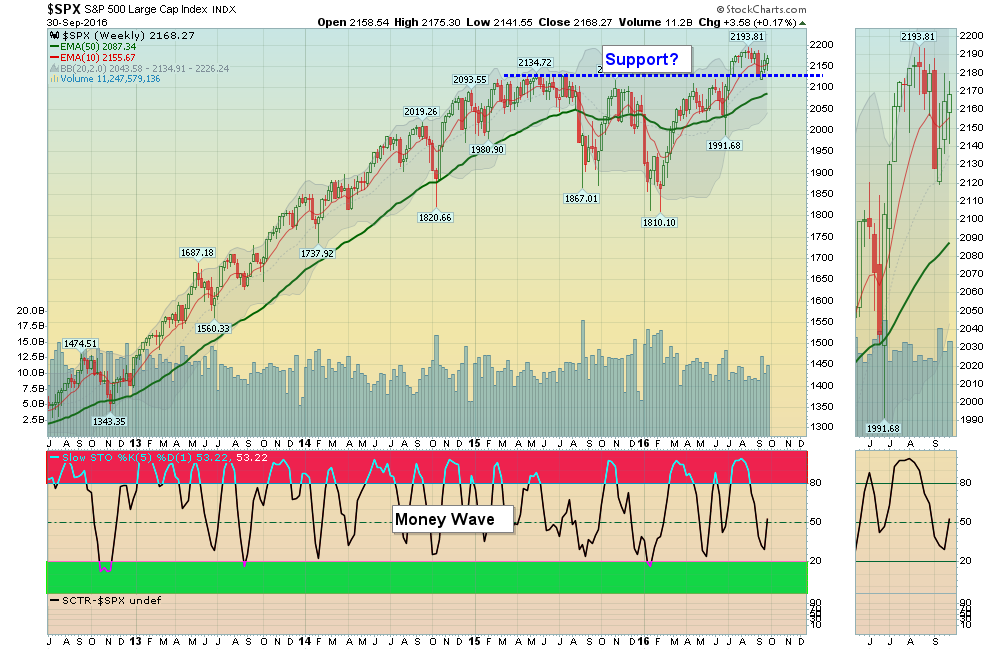
10/01 /2016: Markets were mixed for the week, as the S&P 500 is still trying to go back up to re-test the August high of 2194. If the S&P 500 does not blow thru the August highs, the Markets could be in trouble. Only the Semiconductors and Oil Stocks were strong this week.
Mixed, or sideways Markets indicate indecision from Investors… Apparently many are waiting until our Elections are over next month before making many changes. What we do know, is that Markets are about 5% Above the Green Line, so October could bring in some Selling, back down to the Green Line.
Silver SLV had a Money Wave Buy on Friday. We are currently invested in 6 Open Positions.
Many Leading Funds are now in the Red Zones (probably too late to Buy for the Short Term). We will wait for Green Zone Buys, when Money Waves > 20 . We will email you when they are ready.
Charts for Leaders Watch List Page Closed Positions
Alert! Market Risk High (Red Zone). The probability of successful Short Term Trades is lower, when the S&P 500 is Way Above the Green Line. Even the Strongest Funds can get chopped up. Either take quick gains from Money Wave Pops, or STAY IN CASH & WAIT for a larger correction.
QUESTION from Steve L:
How do I set up a link to my twitter?
ANSWER:
Go to https://twitter.com/AboveGreenLine
Sign in or sign up for Twitter.
Make sure you Follow “Above the Green Line”
Also click on wheel and click “Turn on mobile notifications”
Is there anyway to make your strategy work in the German markets or the forex game. Like things without sctr values
Yes, Brian, just enter the Symbol here
If there is no Symbol, you can manually make a Chart like we did before computers. Make sure the Investment stays Above the Green Line (250 day ema).
Determining Relative Strength would be trickier. The Green Line System works with ALL Investments and Mutual Funds that can be Charted.
Thank you for writing.
If you change the page to “ChartBook View” (click on the blue Button, then you can select the Symbol under the “Contents” tab on the left.
Chartbook View
Good trading, and tell your friends!
Am I correct in my analysis of the closed positions since 6/15/2016 that of the 59 trades 29 were positive and 30 negative and returned a cumulative positive % of +50.27%?
Yes, that is correct (before taxes and commissions).
Normally the ratio of losses is not so high… and the Short Term trades lately have not pushed much higher after the initial pop.
Check what Brian81 says below:
“Managing losses are a lot more important than wins vs losses. I have a 350k account, and following the rules I average 20% rate of return a year. Most people are lucky to break even.”
Managing losses are a lot more important than wins vs losses. I have a 350k account, and following the rules I average 20% rate of return a year. Most people are lucky to break even.
Thanks B!
Sorry for the misdirection of the question. To B point the win loss ratio isn’t the issue. The % profit of all the trades is and so I was trying to understand that. If I worked $1,000 over and over again on 59 trades over 3.5 months and made 1,450 that is a pretty good return. It requires a little more analysis on how much total $ I would have to have to keep making the trades. But in any case the upside seems very promising.
Yes, if you had $1000 in each trade, you will be well ahead, excluding commissions.
The numbers would be much better with $10,000 per trade (to overcome the commission costs).
The Green Line System is similar to the Casinos… Lots of losses, but Win more than you lose,
every night.