Money Flow Index (MFI)
The Money Flow Index indicator (MFI) is a tool used in technical analysis for measuring buying and selling pressure. The Money Flow Index can generate several signals, most notably; overbought and oversold conditions, divergences, and failure swings.
KEY TAKEAWAYS
- The Money Flow Index (MFI) is a technical indicator that generates overbought or oversold signals using both prices and volume data.
- An MFI reading above 80 is considered overbought and an MFI reading below 20 is considered oversold, although levels of 90 and 10 are also used as thresholds.
- A divergence between the indicator and price is noteworthy. For example, if the indicator is rising while the price is falling or flat, the price could start rising.
Money Flow Index (MFI) and the Relative Strength Index (RSI):
- The MFI and RSI are very closely related in construct.
- The main difference is that MFI incorporates volume, while the RSI does not.
- MFI provides lead signals, and warns of possible reversals, in a more timely fashion at times ahead of RSI.
- Just like the RSI, the value of the MFI ranges between 0 and 100, and uses a default setting of 14 periods for its calculation. The Money Flow Index has a high correlation with the RSI, but still differs to some extent as it takes into account the trading volume of the instrument.
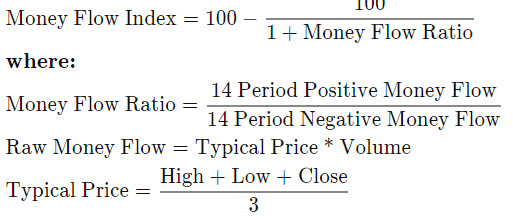
The formula for calculating the Money Flow Index (MFI) is presented below.