Above The Green Line

  • Commentary
    • BUY / SELL SIGNALS
      • Stock Alerts
    • DIVGRO BLOG
    • ETF SECTOR BLOG
    • DOW DOGS BLOG
    • NEWS
    • STOCK IDEAS
  • Strategies
    • SWING TRADING
      • CURRENT POSITIONS
      • WATCHLISTS
      • CLOSED POSITIONS
      • CANDIDATES – TOP 100
      • SPECIALTY STOCKS
    • DAY TRADING
      • Watch List
    • DIVIDEND GROWTH
      • Dividend Growth Portfolio
      • Dividend Calendar
    • DOGS OF THE DOW
      • Dogs of the Dow Portfolio
      • DOW 5 Portfolio
    • ETF SECTOR ROTATION
      • ETF Sector Portfolio
  • Markets
    • US MARKET
      • Commodities
      • Energy
      • Precious Metals
      • Volatility
    • GLOBAL MARKETS
      • MARKET INDICES
      • ECONOMIC CALENDAR
      • FOREX HEAT MAP
      • FOREX CROSS RATES
      • CRYPTOCURRENCY MARKET
    • DASHBOARD
    • IDEAS
  • Investing
    • FORUM
  • Resources
    • ARTICLES
    • WEEKLY STOCK
    • RETIREMENT PLANNING
    • BLOGROLL
    • FAQ
  • About
    • CONTACT US
    • HOW TO WIN
    • #1 AT STOCKCHARTS
  • Log In
  • Subscribe

Chaikin Money Flow Oscillator

Chaikin Money Flow Oscillator

Created by Mark Chaikin, the Chaikin money flow (CMF) oscillator is similar to the more widely used Moving Average Convergence Divergence (MACD) indicator because it uses two different exponentially weighted moving averages (EMAs) to analyze momentum.  It is commonly used by active traders to monitor the flow of money and/or momentum.

KEY TAKEAWAYS

  • Chaikin money flow oscillator and money flow index are both momentum indicators, but the similarities end there because the ways the indicators are calculated and interpreted are different.
  • Chaikin is similar to MACD in that both indicators use exponential moving averages in their calculations.
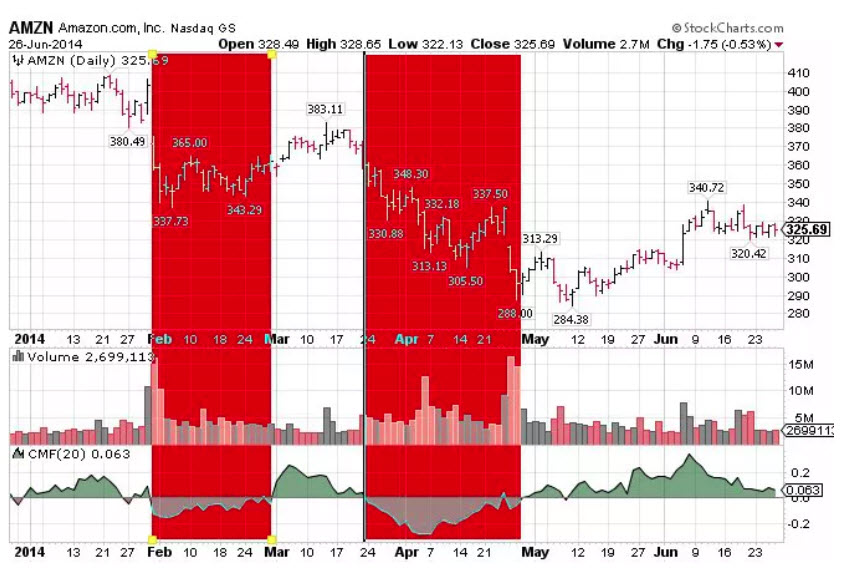
  • When the Chaikin money flow indicator is red, it suggests the market is in a downtrend and when it is green, the indicator suggests an uptrend.
  • Money flow index uses volume in combination with recent price movements to determine trends and to determine whether a market is overbought or oversold.

An example of the CMF oscillator in use given below.

CMF Oscillator
Chaikin Money Flow

Voted #1 at Stock Charts

SH Chart
Inverse S&P 500 Fund (SH) will have a Money Wave Buy today.

Help Us Help Animals

Help Us Help Animals

Recent Comments

  • AbovetheGreenLine on Target was Hit on IVERIC Bio for a 13.4% Gain.
  • Gustavo Covacevich on Target was Hit on IVERIC Bio for a 13.4% Gain.
  • AbovetheGreenLine on Money Wave Alert! Jan 31, 2023
  • tri nguyen on Money Wave Alert! Jan 31, 2023
  • AbovetheGreenLine on Money Wave Alert! Jan 17, 2023

Become a Green Liner!

Help me make more Money in the Stock Market.

Above the Green Line

ON ATGL

  • Weekly Commentary
  • Intraday Buy / Sells
  • Day Trade Setup

STRATEGIES

  • Swing Trading
  • Dividend Growth
  • ETF Sector Rotation
  • Dogs of the Dow

HELP

  • ATGL Trading Rules
  • FAQ
  • Account Maintenance
  • Contact US

© Copyright 2021 · AboveTheGreenLine.com · All Rights Reserved · Privacy · Terms · Contact · WatchList · Current