Above The Green Line

  • Commentary
    • BUY / SELL SIGNALS
      • Stock Alerts
    • DIVGRO BLOG
    • ETF SECTOR BLOG
    • DOW DOGS BLOG
    • NEWS
    • STOCK IDEAS
  • Strategies
    • SWING TRADING
      • CURRENT POSITIONS
      • WATCHLISTS
      • CLOSED POSITIONS
      • CANDIDATES – TOP 100
      • SPECIALTY STOCKS
    • DAY TRADING
      • Watch List
    • DIVIDEND GROWTH
      • Dividend Growth Portfolio
      • Dividend Calendar
    • DOGS OF THE DOW
      • Dogs of the Dow Portfolio
      • DOW 5 Portfolio
    • ETF SECTOR ROTATION
      • ETF Sector Portfolio
  • Markets
    • US MARKET
      • Commodities
      • Energy
      • Precious Metals
      • Volatility
    • GLOBAL MARKETS
      • MARKET INDICES
      • ECONOMIC CALENDAR
      • FOREX HEAT MAP
      • FOREX CROSS RATES
      • CRYPTOCURRENCY MARKET
    • DASHBOARD
    • IDEAS
  • Investing
    • FORUM
  • Resources
    • ARTICLES
    • WEEKLY STOCK
    • RETIREMENT PLANNING
    • BLOGROLL
    • FAQ
  • About
    • CONTACT US
    • HOW TO WIN
    • #1 AT STOCKCHARTS
  • Log In
  • Subscribe

Money Wave and Green Zones

Q: What is the Money Wave?

A: The Money Wave is a simple name for the Slow Stochastic 5,1 Indicator on the Daily Charts. Buy when the Money Wave is coming out of the Green Zone, and take profits in the Red Zone.

Money Wave Chart
Money Wave

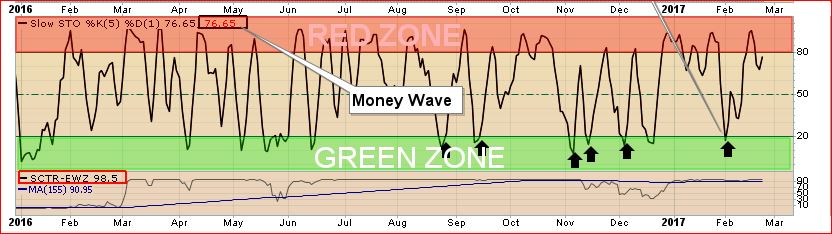
Q: What is the Green Zone?

A: The Green Zone is an Over-Sold level to Buy soon when the Money Wave (or Slow Stochastic) is Below 20. Buying in the Green Zone has a higher probability of success than Buying in the Red Zone (Above 80 on Money Wave).
The Money Wave must Close in the Green Zone (Below 20) to be a candidate for a Short Term Money Wave Buy Signal.
The Money Wave Closing > 20 creates a Short Term Buy Signal.

Q: When I get an email Buy Alert, what price do I buy at?

A: When a Money Wave Buy Signal will occur (Money Wave is going to Close > 20 that day) , we will email you an Alert 10-20 minutes before the Market Closes. Buy anytime before, or on the Close.  For logging of the final trade price, we will use the Closing Price on the day the Money Wave Closes > 20.

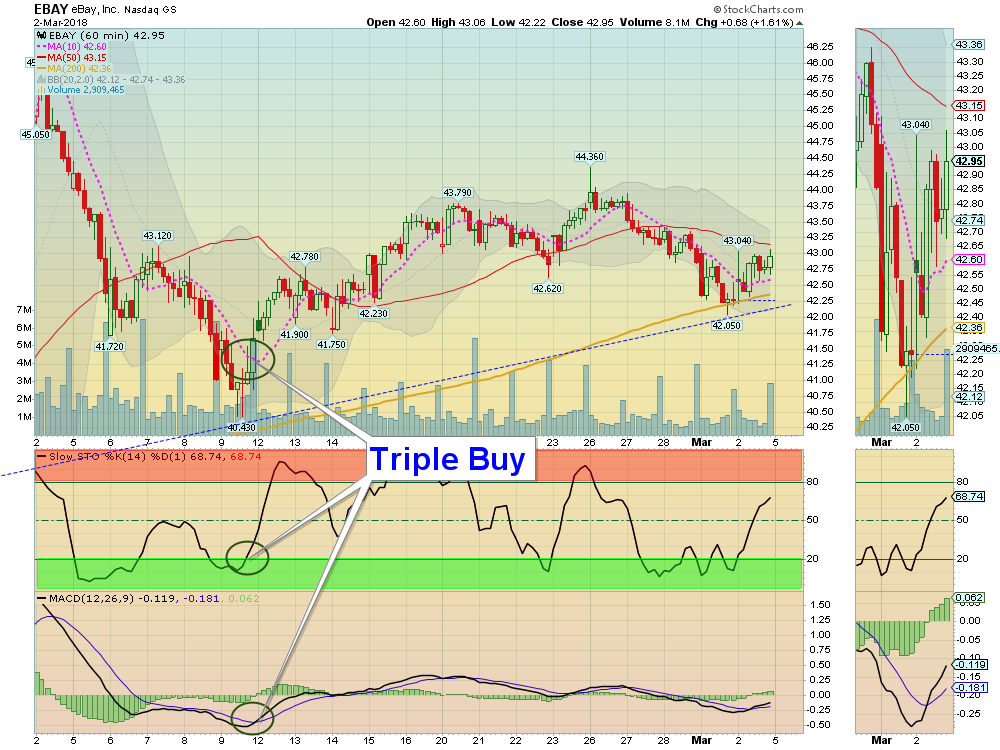
To shop for a better price during the day, many will go to the 60-min chart, and Buy in advance of the Close, but only if the Daily Money Wave is going to Close >20. Here we will look for  “Triple Buy Signals”.  Wait for the Investment on the 60-min Chart to at least cross up above the Pink Line (10-hour average).

Use the 60-min Charts here: Day Trading Scrolling Charts. and preferably wait for a “Triple Buy Signal”  (1. Above Pink Line 2. Above 20 on Money Wave 3. MCAD Buy).

Triple Buy
Triple Buy on 60-min Chart. 

Day Trading Scrolling Charts.

Voted #1 at Stock Charts

SH Chart
Inverse S&P 500 Fund (SH) will have a Money Wave Buy today.

Help Us Help Animals

Help Us Help Animals

Recent Comments

  • Money Wave Alert! Mar 29, 2023 – InvFuture Education on Money Wave Alert! Mar 29, 2023
  • Money Wave Alert! Mar 28, 2023 – InvFuture Education on Money Wave Alert! Mar 28, 2023
  • Viking Thera. (VKTX) up 58% today. – InvFuture Education on Viking Thera. (VKTX) up 58% today.
  • Money Wave Alert! Mar 27, 2023 – InvFuture Education on Money Wave Alert! Mar 27, 2023
  • Green Line Weekly! Mar 26, 2023 – InvFuture Education on Green Line Weekly! Mar 26, 2023

Become a Green Liner!

Help me make more Money in the Stock Market.

Above the Green Line

ON ATGL

  • Weekly Commentary
  • Intraday Buy / Sells
  • Day Trade Setup

STRATEGIES

  • Swing Trading
  • Dividend Growth
  • ETF Sector Rotation
  • Dogs of the Dow

HELP

  • ATGL Trading Rules
  • FAQ
  • Account Maintenance
  • Contact US

© Copyright 2021 · AboveTheGreenLine.com · All Rights Reserved · Privacy · Terms · Contact · WatchList · Current