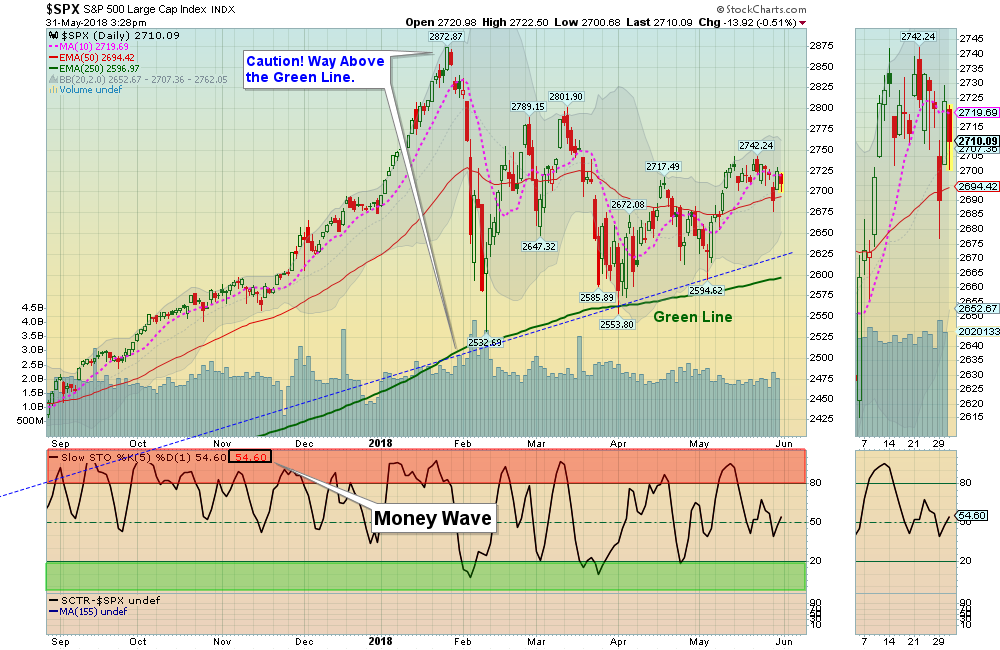
Markets were lower today on very sluggish trading. Most will not worry as long as the S&P 500 is Above the Red Line (50-day avg.) However, many of the Leaders are back up in the Red Zones (probably too late to Buy for the Short Term).
Crude Oil was down today at $67.10.
Please be patient, and WAIT for the Leading Investments to return to the Green Zones for more Money Wave Buy Signals.
_____________________________________________________________________________________
The Following Investments will probably have a Money Wave Buy Signal soon.
(Slow Stochastic Closing > 20) on today’s Close.
BUYS TODAY
SPLK SPLUNK INC. Money Wave Buy today. Place Sell Stop Loss below Support of $107.08 on the Close.
USO US OIL FUND Money Wave Buy today. Place Sell Stop Loss below Support of $13.33 on the Close.
WTI W&T OFFSHORE Money Wave Buy today. Place Sell Stop Loss below Support of $6.31 on the Close.
Money Wave Buys soon for:
WTW WEIGHT WATCHERS INT’L.
Please be patient and wait for Money Wave Buy Signals. We will email you when they are ready. Click on Watch List.
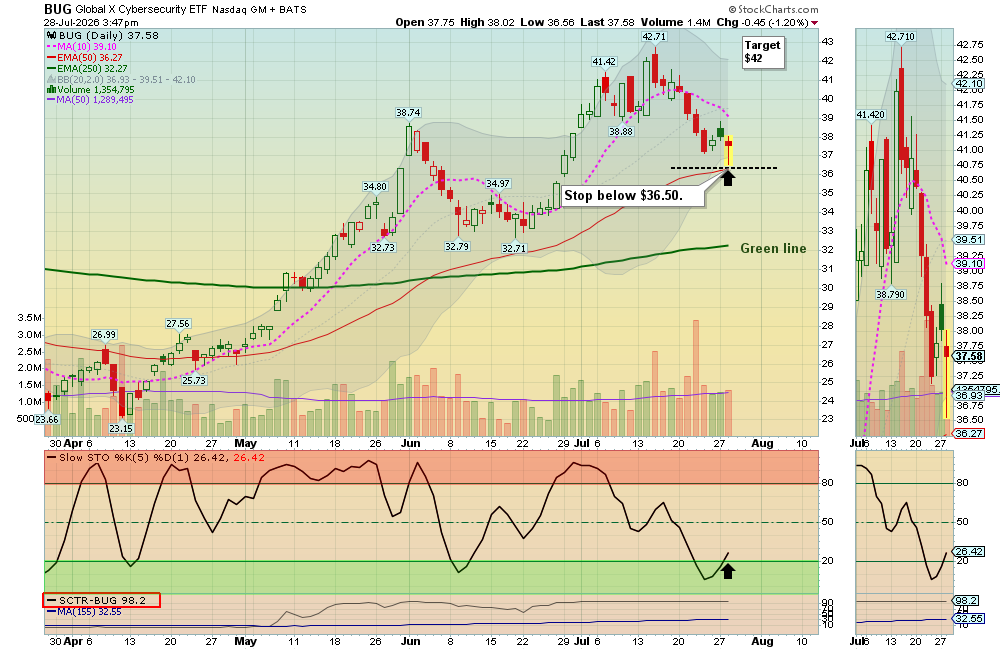
Emotions are very high now, so please do not Buy unless you are VERY NIMBLE. The Leaders are still Way Above the Green Lines (all Investments eventually return to their Green Lines).
______________________________________________________________________________________
SELLS TODAY
EXIT ANF ABERCROMBIE & FITCH if it is going to Close Below the Red Line around $28.28. This trade was not logged.
Please Check PORTFOLIO (Open Positions) and adjust your Sell Stops.
Click for CLOSED POSITIONS.
Many like to Buy the day before, near the Close, if the Money Wave is going to create a Buy Signal (Closing > 20).
Don’t Buy if the Investment has already popped up too much. Money Wave Buys are usually good for a 3-6 % move in a few days. We will “Not Log” trades if the Reward/Risk is not at least 2:1.
Related Post
– WTW