Above the Green Line -01
  • Market Insights
        • Commentary
          • Daily
          • Weekly
        • BUY / SELL SIGNALS
          • Trade Posts
          • Recent Trade Alerts
          • Recent Day Trades
        • BLOGROLL
          • Dividend Growth Blog
          • ETF Sector Blog
          • Dow Dogs
          • TPOW Blog
  • Strategies
        • SWING TRADING
          • Current Positions
          • Watchlists
          • Closed Positions
          • Candidates - TOP 100
          • Specialty Stocks
        • WEEKLY STOCK PICK
          • TPOW Charts
          • TPOW Performance
          • TPOW Strategy Guide
          • TPOW Performance Dashboard
        • DAY TRADING
          • Watch List
        • ATGL DASHBOARD
        • ETF STRATEGIES
          • ETF Sector Rotation
          • ETF Sector Portfolio
        • DIVIDEND GROWTH
          • Dividend Growth Portfolio
          • Dividend Calendar
        • DOGS OF THE DOW
          • Dogs of the Dow Portfolio
          • DOW 5 Portfolio
  • Markets
        • US MARKET
          • Commodities
          • Energy
          • Precious Metals
          • Volatility
        • GLOBAL MARKETS
          • Market Indices
          • Economic Calendar
          • FOREX Heat Map
          • FOREX Cross Rates
          • Crypto Currency Market
  • Investing
    • Discord Community
    • Dashboard
  • Resources
        • ARTICLES
          • Dividend Growth Model Articles
          • ETF Articles
          • Investment Strategies Articles
          • Market and Economic Insights
          • Stock Trade Articles
          • Stock Reviews
        • TOOLS
          • Stock Scanners
          • Charting Software
          • Brokerage Firms
        • STOCK CHARTS
          • Key Components
          • Reading Charts
          • Drawing Stock Charts
          • Identifying Trends
        • RETIREMENT PLANNING
  • About
    • Contact Us
    • How to Win
    • #1 At Stockcharts
    • Disclaimer
    • FAQ
  • Log In
  • Subscribe

July 2, 2019

Money Wave Alert! Jul 2, 2019

TLT Chart
Treasury Bonds (TLT) still don’t believe in the Economy.


Markets  were mixed today on low pre-holiday Volume. The Indices now need to make Higher Highs soon for the rally to continue. There are not many Buyers around with the July 4th Holiday coming on Thursday.

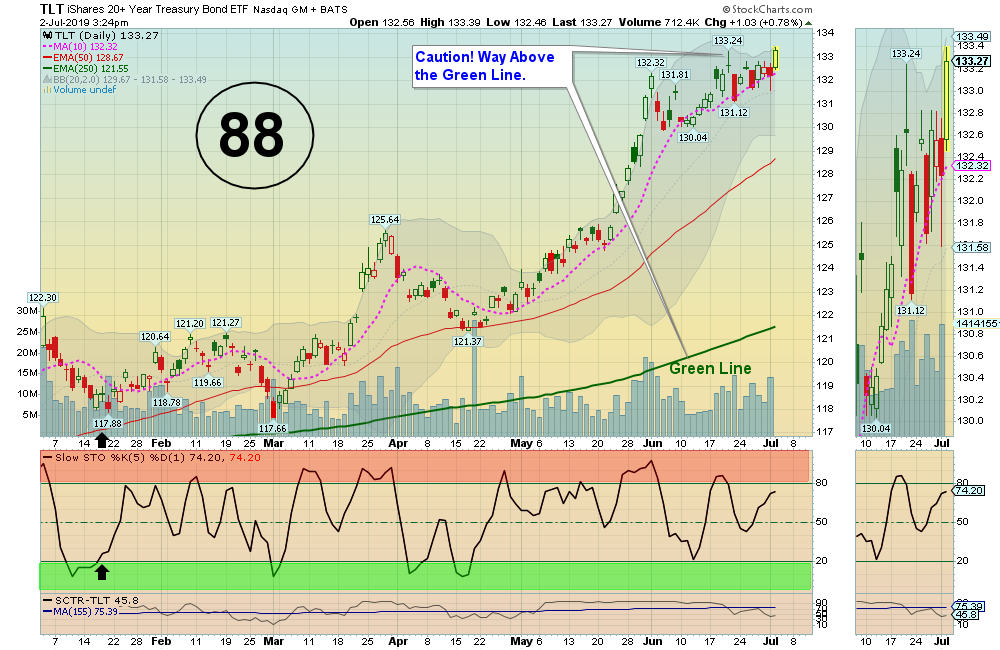
Bonds are back on Highs, but are Way Above the Green Line.

Please be patient and WAIT for the Money Wave Buy signals below. 


Crude Oil was down $2.06  today at $57.03. ______________________________________________________________________________________________________

The Following Investments will probably have a Money Wave Buy Signal soon.
(Slow Stochastic Closing > 20) on today’s Close.


BUYS TODAY    7/02/2019    


ROKU     ROKU INC.      Medium Term Buy. Target is  $107.00.  EXIT if it is going to Close Below the Support of $87.34.


CIEN     CIENA CORP.     Money Wave Buy today.  CIEN  will not be logged as the Volume is way below average.

XLRE     REAL ESTATE FUND     Money Wave Buy today.  XLRE will not be logged as the Reward / Risk does not look like it will be 2:1.

XLU     UTILITIES FUND    Money Wave Buy today.  XLU  will not be logged as the Volume is way below average.


Money Wave Buys Signals Soon:   (Best to Buy these when the S&P 500 is also in the Green Zone.)          

GBTC    GRAYSCALE BITCOIN TRUST     Money Wave must Close in the Green Zone.    

SNAP     SNAP, INC.    Money Wave must Close in the Green Zone.

TWLO     TWILIO      Buy when it is going to Close above the Pink Line of  $139.25.


Please be patient and wait for Money Wave Buy Signals.  We will email you when they are ready. Click on Watch List.

Emotions are very high now, so please do not Buy unless you are VERY NIMBLE. The Leaders are Way Above the Green Lines (all Investments eventually return to their Green Lines).

______________________________________________________________________________________


SELLS TODAY   


EXIT    ZNGA     ZYNGA INC.     on the Close today, or have a tight Sell Stop Loss below it to capture a quick 4% Gain.


Check   PORTFOLIO  (Open Positions) and adjust your Sell Stops.

Click for  CLOSED POSITIONS.


Many like to Buy the day before, near the Close, if the Money Wave is going to create a Buy Signal (Closing > 20).

Don’t Buy if the Investment has already popped up too much. Money Wave Buys are usually good for a 3-6 %  move in a few days.

We will “Not Log” trades if the Reward/Risk is not at least 2:1.   

Related Post

– Money Wave Alert! Jul 1, 2019

Subscribe to Our Newsletter

AGL Logo

Get our eBook Now!

Candlestick - A Swing Traders Friend

We don’t spam! Read our privacy policy for more info.

You’ve been successfully subscribed to our newsletter!

Voted #1 at Stock Charts

SH Chart
Inverse S&P 500 Fund (SH) will have a Money Wave Buy today.

Help Us Help Animals

Help Us Help Animals

Recent Comments

  • Market Breadth Indicators: A Trader’s Guide to Early Trend Detection on Backtesting: Definition and How a Trading Strategy Backtest Works
  • Island Reversal Pattern: Definition and Formation Explained on Double Top Pattern: How to Identify and Trade This Reversal Signal
  • Channel Pattern Guide: What It Is and Why It Matters on A Guide to Forecasting Using Moving Averages
  • What Is a Broadening Bottom Chart Pattern? Full Guide on Bull vs. Bear Market: An Investor’s Guide to Market Phases
  • ATGL Weekly Money Flow - 2025-05-11 on ATGL Top Pick of the Week! Apr 6, 2025

Become a Green Liner!

Help me make more Money in the Stock Market.

ON ATGL

  • DashBoard
  • Weekly Commentary
  • Daily Buy / Sell Signals
  • Day Trade Setup
  • Trading Rooms

Design & Develop By Pixelvect

STRATEGIES

  • Swing Trading
  • ATGL Pick of the Week
  • Dividend Growth
  • ETF Sector Rotation
  • Dogs of the Dow

HELP

  • ATGL Trading Rules
  • FAQ
  • Account Maintenance
  • Contact US
  • Join

FOLLOW US

Instagram Linkedin Twitter Facebook

© COPYRIGHT 2024 · ABOVETHEGREENLINE.COM · ALL RIGHTS RESERVED · PRIVACY · TERMS · CONTACT · WATCHLIST · CURRENT