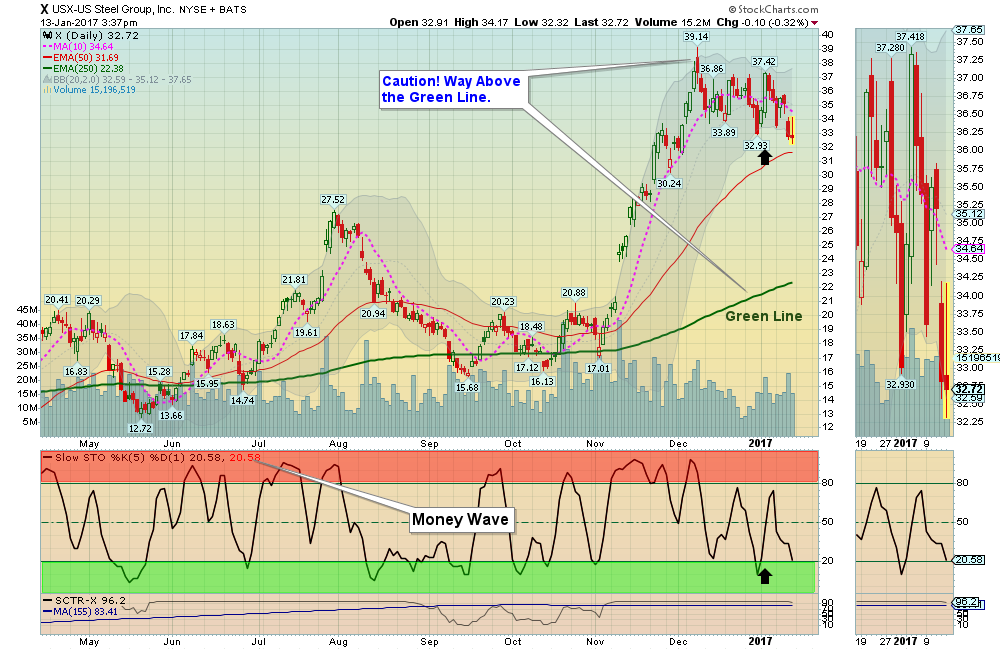
Money Wave Buy soon on US STEEL!
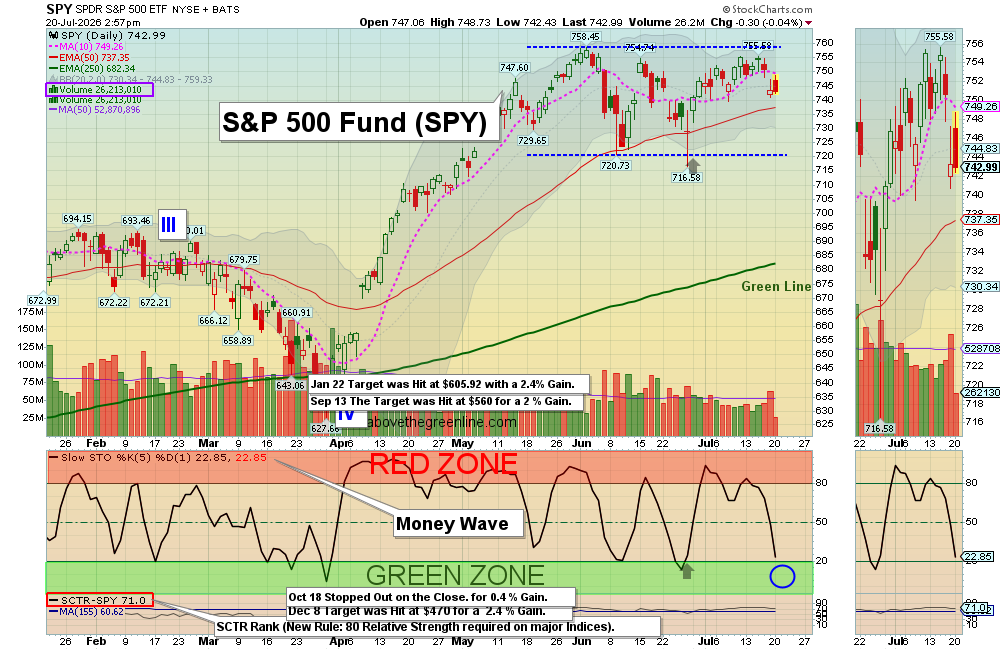
The Markets are up slightly today, as the S&P 500 holds above the Pink Line (10-day avg.) to avoid a Short Term Sell Signal. It is still struggling around the December High of 2277… So far it is not a Good Break-Out on the S&P 500.
Maybe the Inauguration News will rock the Markets out of this 5 week Sideways period! Yes, this gets OLD, Waiting for a pull-back. But the Euphoria of Human Emotion (VIX Indicator) says it will correct.
The Reward / Risk ratio of investing now is poor, so please do not Buy then unless you are VERY NIMBLE, as the Leaders are still Way Above the Green Lines.
We are waiting for the S&P 500 to correct back down near the Red Line (50-day avg.) to set up for a good bounce.
Money Wave Buys soon!
The Following Investments will probably have a Money Wave Buy Signal
(Slow Stochastic Closing > 20) on today’s Close.
NONE TODAY
SELLS
We will LOWER the Sell Stop Loss on OAS to $14.45 on the Close.
EXIT OIH if it Closes Below the Pink Line of $34.35.
ON DECK to Buy soon: PIR WNR & X Wait for GREEN ZONE BUYS. We will email or text when they are ready.
Click for WATCH LIST
Click for OPEN POSITIONS
Click for CLOSED POSITIONS
Many like to buy the day before, if the Investment has not popped up too much.
Money Wave Buys are usually good for a 3-6 % move in a few days.
About 1/3 of the time, the Money Wave Buys will result small losses, so please use a Sell Stop Loss after all Buy orders.
i looked at your VIX indicator (XIV;VXX) in your Jan 13 comment, Could you explain it? What does it tell you the Vix does not? Thanks
The XIV:VXX Chart has gone PARABOLIC which is PANIC BUYING and not sustainable. Also the Indicator is Way Above the Green Line, and we know how that ends… The Herd is Convinced that Trumpism will take the Markets much Higher, and has PANIC BOUGHT! This is how many LOSE MONEY, because they don’t know WHERE THE GREEN LINE IS.
A trained monkey can learn to Buy in Green Circles, and Sell in Red Circles, but Humans have EMOTIONS which FAIL them most of the time.
Hi, What is the criteria for Long term stock buy? Is it the same as green >20 . Thanks
Yes, Long Term RULES require Above the Green Line + > 90 Relative Strength.
Thank you for writing.
“Yes, Long Term RULES require Above the Green Line + > 90 Relative Strength.”
Need further elaboration . Is it on the daily time frame or weekly time frame chart.? Thanks .Sheikh
Hi , I am still waiting for reply on my question although You have checked my subscription via email yesterday.
Your comment is awaiting moderation.
“Yes, Long Term RULES require Above the Green Line + > 90 Relative Strength.”
Need further elaboration . Is it on the daily time frame or weekly time frame chart.? Thanks .Sheikh
Thank you for your question. The Green Line is the 250 day ema (Exponential Moving Average}.
On a weekly Chart, it is a 50 week ema (also 250 days)… Make sure the Green Line on Daily Chart is 250 days, and Weekly Chart is 50 week average.