Above The Green Line

  • Commentary
    • BUY / SELL SIGNALS
      • Stock Alerts
    • DIVGRO BLOG
    • ETF SECTOR BLOG
    • DOW DOGS BLOG
    • NEWS
    • STOCK IDEAS
  • Strategies
    • SWING TRADING
      • CURRENT POSITIONS
      • WATCHLISTS
      • CLOSED POSITIONS
      • CANDIDATES – TOP 100
      • SPECIALTY STOCKS
    • DAY TRADING
      • Watch List
    • DIVIDEND GROWTH
      • Dividend Growth Portfolio
      • Dividend Calendar
    • DOGS OF THE DOW
      • Dogs of the Dow Portfolio
      • DOW 5 Portfolio
    • ETF SECTOR ROTATION
      • ETF Sector Portfolio
  • Markets
    • US MARKET
      • Commodities
      • Energy
      • Precious Metals
      • Volatility
    • GLOBAL MARKETS
      • MARKET INDICES
      • ECONOMIC CALENDAR
      • FOREX HEAT MAP
      • FOREX CROSS RATES
      • CRYPTOCURRENCY MARKET
    • DASHBOARD
    • IDEAS
  • Investing
    • FORUM
  • Resources
    • ARTICLES
    • WEEKLY STOCK
    • RETIREMENT PLANNING
    • BLOGROLL
    • FAQ
  • About
    • CONTACT US
    • HOW TO WIN
    • #1 AT STOCKCHARTS
  • Log In
  • Subscribe

February 9, 2018

Money Wave Alert! Feb 9, 2018

SPX Chart
S&P 500 almost Tagged the Green Line, and Bounced!


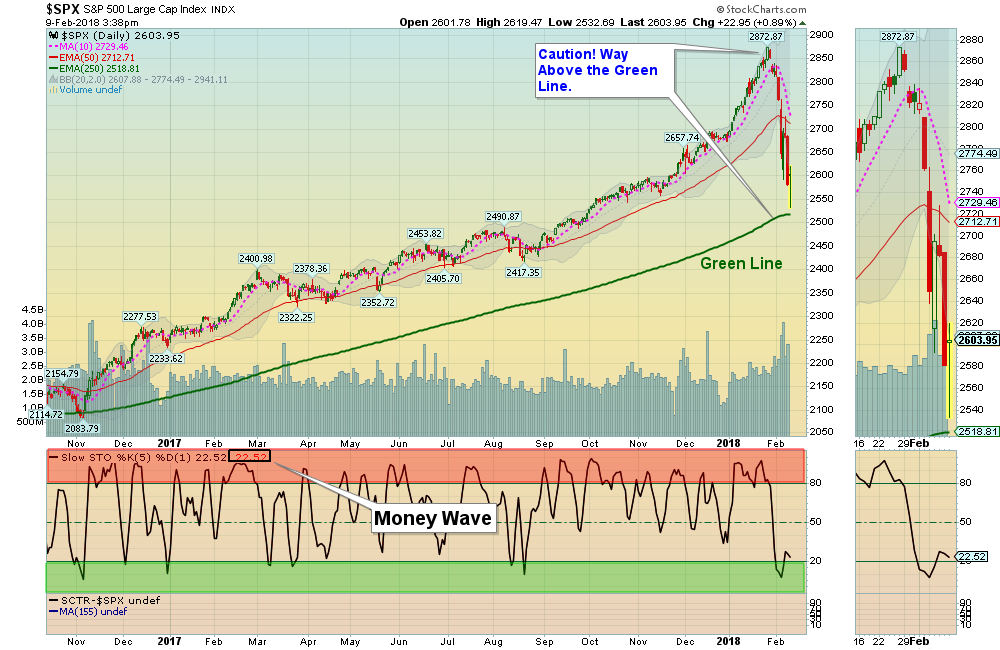
Markets are finally back down near the Green Lines (250 day avgs,) which is what we have been preaching about for many months now.  Now most Indices are no longer over-bought, and are more Fairly Valued.

Usually Investments that just made New Highs, (like most Indices) will bounce when they get back down near the Green Lines. This has not happened since Nov 2016, so newer investors that bought on the Jan. Highs are scared and now their account values have dropped.

The current Open Positions are holding up ok Above the Green Lines, so some of the Sell Stop Losses have temporarily been Lowered down to the Green Lines until this selling Wave is over. The few very Strongest Leaders (BA AMZN NFLX NVDA) are still Above their Red Lines (50-day avgs.) indicating that there is really not much Selling going on.

Try to Buy Investments that recently made new Highs, and Held ABOVE the Red Lines. Usually these will bounce the quickest.

Crude Oil  is down today at $60.70.

_____________________________________________________________________________________

Money Wave Buys soon!  
The Following Investments will probably have a Money Wave Buy Signal soon.
(Slow Stochastic Closing > 20) on today’s Close.


BUYS TODAY    NONE TODAY 


Money Wave Buys soon for:

EBAY    EBAY INC.
EWZ    BRAZIL FUND
OIL    CRUDE OIL FUND
ON    ON SEMICONDUCTOR
PBR    PETROBRAS OIL
RSX    RUSSIA FUND
STX    STORAGE TECH
WTI    W&T OFFSHORE INC.


Please be patient and wait for Money Wave Buy Signals.  We will email you when they are ready. Click on Watch List.

Emotions are very high now, so please do not Buy unless you are VERY NIMBLE. The Leaders are still Way Above the Green Lines (all Investments eventually return to their Green Lines).

______________________________________________________________________________________

SELLS TODAY     

LOWER   HFC    HOLLY FRONTIER    Sell Stop Loss to the Green Line of $37.12 (until Mkt. sell off is over).

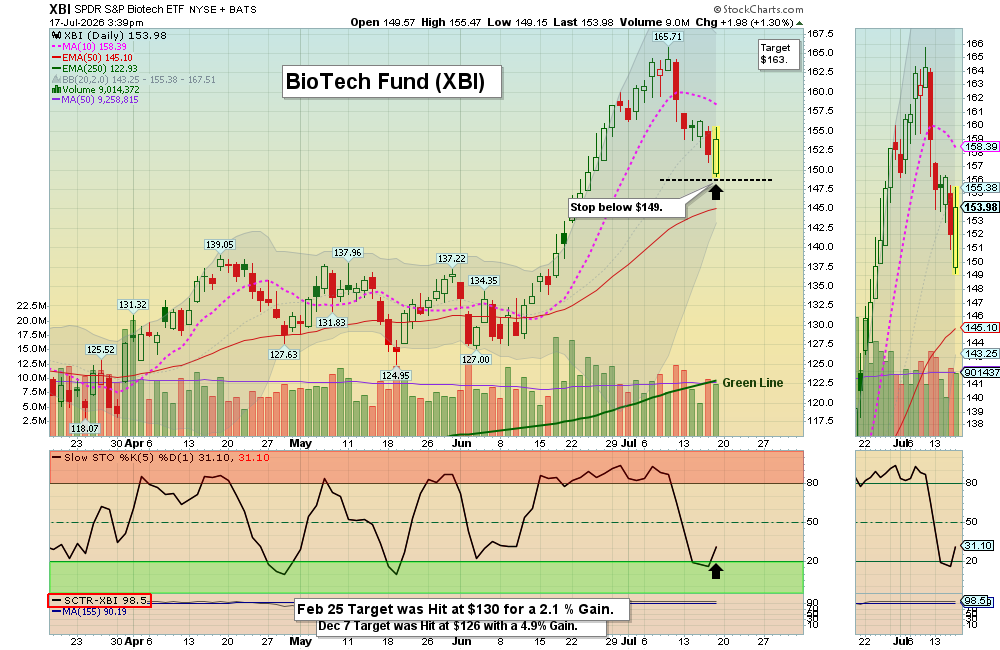
LOWER   XBI    BIOTECH FUND     Sell Stop Loss to the Green Line of $79.37 (until Mkt. sell off is over).


Please Check   PORTFOLIO  (Open Positions) and adjust your Sell Stops.

Click for  CLOSED POSITIONS.

Many like to Buy the day before, near the Close, if the Money Wave is going to create a Buy Signal (Closing > 20).

Don’t Buy if the Investment has already popped up too much. Money Wave Buys are usually good for a 3-6 %  move in a few days. We will “Not Log” trades if the Reward/Risk is not at least 2:1.


HAVE A NICE WEEKEND!

Posted By AbovetheGreenLine at 2:44 pm 2 Comments

Comments

  1. davidreid says

    February 12, 2018 at 2:32 pm

    What is the swing low?

    Log in to Reply
    • AbovetheGreenLine says

      February 12, 2018 at 5:44 pm

      Hi David. The Swing Low is Support for the last few days, where the Investment tries to Bounce.

      We are betting that the Money Wave Indicator is correct, and the Investment has bottomed for the Short Term.

      If not, we normally will EXIT.

      EWZ Chart has a Swing Lown on Friday of $$41.84. EWZ Chart

      Log in to Reply

Leave a Reply Cancel reply

You must be logged in to post a comment.

Voted #1 at Stock Charts

SH Chart
Inverse S&P 500 Fund (SH) will have a Money Wave Buy today.

Help Us Help Animals

Help Us Help Animals

Recent Comments

  • AbovetheGreenLine on Target was Hit on IVERIC Bio for a 13.4% Gain.
  • Gustavo Covacevich on Target was Hit on IVERIC Bio for a 13.4% Gain.
  • AbovetheGreenLine on Money Wave Alert! Jan 31, 2023
  • tri nguyen on Money Wave Alert! Jan 31, 2023
  • AbovetheGreenLine on Money Wave Alert! Jan 17, 2023

Become a Green Liner!

Help me make more Money in the Stock Market.

Above the Green Line

ON ATGL

  • Weekly Commentary
  • Intraday Buy / Sells
  • Day Trade Setup

STRATEGIES

  • Swing Trading
  • Dividend Growth
  • ETF Sector Rotation
  • Dogs of the Dow

HELP

  • ATGL Trading Rules
  • FAQ
  • Account Maintenance
  • Contact US

© Copyright 2021 · AboveTheGreenLine.com · All Rights Reserved · Privacy · Terms · Contact · WatchList · Current