Above The Green Line

  • Commentary
    • BUY / SELL SIGNALS
      • Stock Alerts
    • DIVGRO BLOG
    • ETF SECTOR BLOG
    • DOW DOGS BLOG
    • NEWS
    • STOCK IDEAS
  • Strategies
    • SWING TRADING
      • CURRENT POSITIONS
      • WATCHLISTS
      • CLOSED POSITIONS
      • CANDIDATES – TOP 100
      • SPECIALTY STOCKS
    • DAY TRADING
      • Watch List
    • DIVIDEND GROWTH
      • Dividend Growth Portfolio
      • Dividend Calendar
    • DOGS OF THE DOW
      • Dogs of the Dow Portfolio
      • DOW 5 Portfolio
    • ETF SECTOR ROTATION
      • ETF Sector Portfolio
  • Markets
    • US MARKET
      • Commodities
      • Energy
      • Precious Metals
      • Volatility
    • GLOBAL MARKETS
      • MARKET INDICES
      • ECONOMIC CALENDAR
      • FOREX HEAT MAP
      • FOREX CROSS RATES
      • CRYPTOCURRENCY MARKET
    • DASHBOARD
    • IDEAS
  • Investing
    • FORUM
  • Resources
    • ARTICLES
    • WEEKLY STOCK
    • RETIREMENT PLANNING
    • BLOGROLL
    • FAQ
  • About
    • CONTACT US
    • HOW TO WIN
    • #1 AT STOCKCHARTS
  • Log In
  • Subscribe

June 24, 2018

Green Line Weekly Jun 24, 2018

WLSH Chart
Wilshire 5000 Index best represents all US Equities, and must make New Highs soon.


06/24/2018:  Markets were down for the week, as the Large Cap DOW & S&P 500 Indices struggled. Quarterly Earnings are starting to come out. For the week, the Dow ended down about 2%, the S&P 500 ended 0.9% lower, and the Nasdaq finished 0.3% lower.

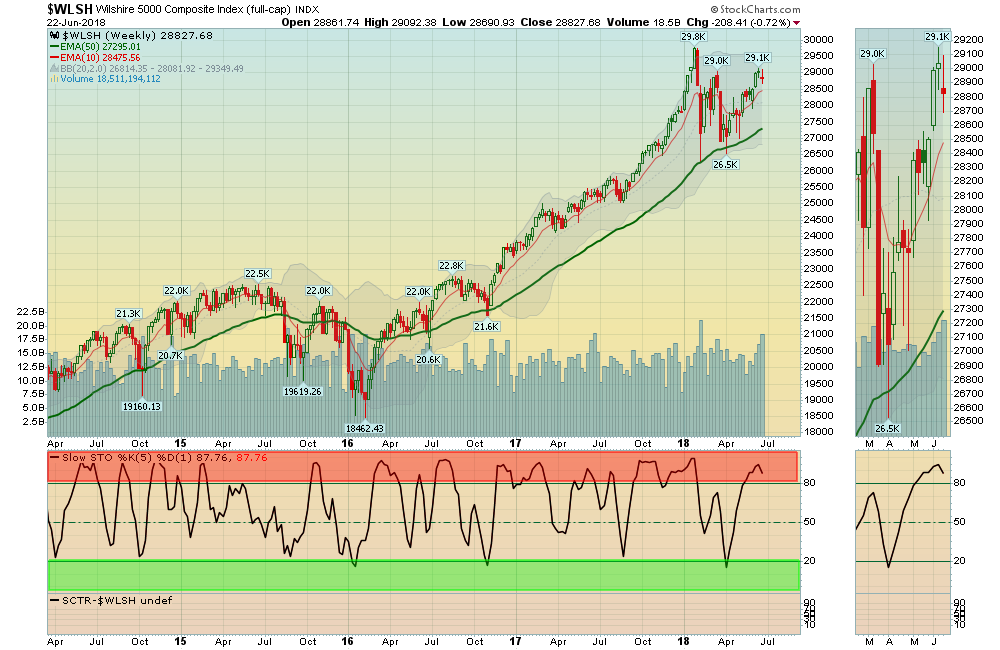
The DOW & S&P 500 Indices need to make Higher Highs soon for this rally to continue. Closing Below the Red Lines would be “Bearish”. The Long Term Trend is UP.

The Inflation Index (CRB) was up 0.66% after bouncing off the Green Line to stay in a mild Up-Trend.

Bonds  were mixed for the week, just Below the Green Line and are Bearish.

The US DOLLAR  was near the Highs for the year, and pulled back 0.36%. 

Crude Oil was up 5.41% for the week at $68.58, and GOLD was down  0.61%.

___________________________________________________________________________________________

MONEY WAVE BUYS SOON:   

We are currently in 4 logged Open Positions, for the Short & Medium Term. Many of the Leading Investments are back up in the Red Zones. There are 5 Investments on the Short Term Watch List. 

Be patient and WAIT for Green Zone Buys!

______________________________________________________________________________________________

LONG TERM TRADES 

The Funds below are correcting down to their Green Lines, but the Relative Strength is remaining high. These tend to Bounce nicely when the weekly Money Wave crosses up > 20.


FCAU     FIAT CHRYSLER    Wait for Weekly Money Wave Close > 20.

IBKR    INTERACTIVE BROKERS    Wait for Weekly Money Wave Close > 20.

IOVA    IOVANCE BIOTHERA.      Wait for Weekly Money Wave Close > 20.

SCCO    SOUTHERN COPPER    Wait for weekly Close Above the Red Line of $51.56 (50-day avg.)

SGMO    SANGAMO THERA    Wait for a Daily Close above $16.90, then use Green Line as Sell Stop. 

WB    WEIBO CORP.     Buy if Closes above $112.03.

___________________________________________________________________________________________

Click for  Portfolio (Open Positions)  
Click for  Watch List
Click for  Closed Positions


Alert! Market Risk is Medium (Yellow Zone). The probability of successful Short Term Trades is higher, when the S&P 500 is down near the Green Line. 


Tell your Friends about the Green Line, and Help Animals.


QUESTION:  Mark writes “Hello, new subscriber here. You system looks great, I love the lack of complexity.

Wondering if you ever are okay with people buying the day or two before a complete signal, if it’s looking very likely the signal will be met?  I see that it looks like when the signal is greenlighted it’s often perhaps too late to get in.  Thank you.”  

ANSWER:   Yes, sometimes the Strongest Investments never Close in the Green Zone, and bounce back up again.  It is OK for you to Buy early and break the Rules, but only if you put in a real Sell Stop Loss below your Buy Price. Many subscribers use the 60-min Chart Signals to jump the gun.

But for all Followers, we follow the Rules strictly, so we all agree on the Buy & Sell prices.

Posted By AbovetheGreenLine at 1:04 pm 2 Comments

Comments

  1. Ted says

    June 25, 2018 at 7:32 am

    Why are some stocks that are listed in the portfolio also show up in the closed positions. Example URBN

    Log in to Reply
    • AbovetheGreenLine says

      June 25, 2018 at 9:09 am

      Hi Ted, and thank you for writing.

      The Money Wave System bought URBN on 2018-03-15 at $35.38 and sold on 2018-04-05 at $38.55 for an 8.96% Gain.
      Now the Money Wave System has bought URBN again on 2018-06-20 at $46.32.

      Good trading, and tell your friends!

      Log in to Reply

Leave a Reply Cancel reply

You must be logged in to post a comment.

Voted #1 at Stock Charts

SH Chart
Inverse S&P 500 Fund (SH) will have a Money Wave Buy today.

Help Us Help Animals

Help Us Help Animals

Recent Comments

  • psychess on Green Line Weekly Jun 4, 2023
  • AbovetheGreenLine on Money Wave Alert! May 19, 2023
  • Robert Zieman on Money Wave Alert! May 19, 2023
  • Volodymyr Gelfand on Monet Wave Alert! May, 18, 2023
  • Money Wave Alert! May 16, 2023 – InvFuture Education on Money Wave Alert! May 16, 2023

Become a Green Liner!

Help me make more Money in the Stock Market.

Above the Green Line

ON ATGL

  • Weekly Commentary
  • Intraday Buy / Sells
  • Day Trade Setup

STRATEGIES

  • Swing Trading
  • Dividend Growth
  • ETF Sector Rotation
  • Dogs of the Dow

HELP

  • ATGL Trading Rules
  • FAQ
  • Account Maintenance
  • Contact US

© Copyright 2021 · AboveTheGreenLine.com · All Rights Reserved · Privacy · Terms · Contact · WatchList · Current