
Aroon Indicator
Developed by Tushar Chande in 1995, Aroon is an indicator system that determines whether a stock is trending or not and how strong the trend is.
Technical indicators such as Aroon help traders evaluate market trends and identify potential trading opportunities based on price behavior. Investors who want a broader understanding of how technical analysis fits into the overall process of buying and selling stocks can review the Stock Trading Guide, which outlines the core principles behind stock trading and market analysis.
KEY TAKEAWAYS
- The Arron indicator is composed of two lines. An up line which measures the number of periods since a High, and a down line which measures the number of periods since a Low.
- The indicator is typically applied to 25 periods of data, so the indicator is showing how many periods it has been since a 25-period high or low.
- When the Aroon Up is above the Aroon Down, it indicates bullish price behavior.
- When the Aroon Down is above the Aroon Up, it signals bearish price behavior.
- Crossovers of the two lines can signal trend changes. For example, when Aroon Up crosses above Aroon Down it may mean a new uptrend is starting.
- The indicator moves between zero and 100. A reading above 50 means that a high/low (whichever line is above 50) was seen within the last 12 periods.
- A reading below 50 means that the high/low was seen within the 13 periods.
Calculation of the Aroon Indicator requires the tracking of the high and low prices, typically over 25 periods.
- Track the highs and lows for the last 25 periods on an asset.
- Note the number of periods since the last high and low.
- Plug these numbers into the Up and Down Aroon formulas.
The formula for the Aroon indicator is provided below for reference.
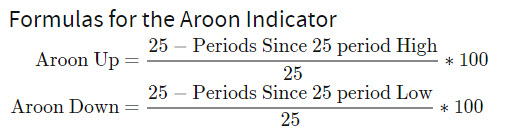
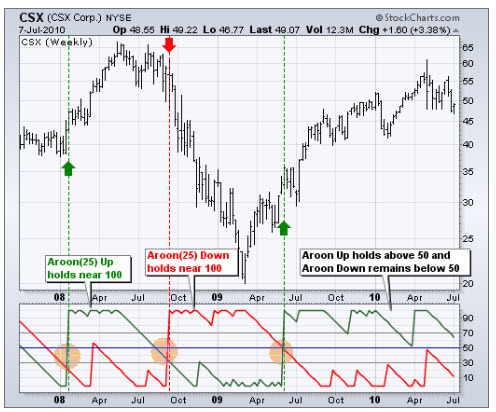
The Chart below shows an example of How to use the Aroon Indicator.
Final Thoughts
Aroon-Up and Aroon-Down are complementary indicators that measure the elapsed time between new x-day highs and lows, respectively. They are shown together so chartists can easily identify the stronger of the two and determine the trend bias.