
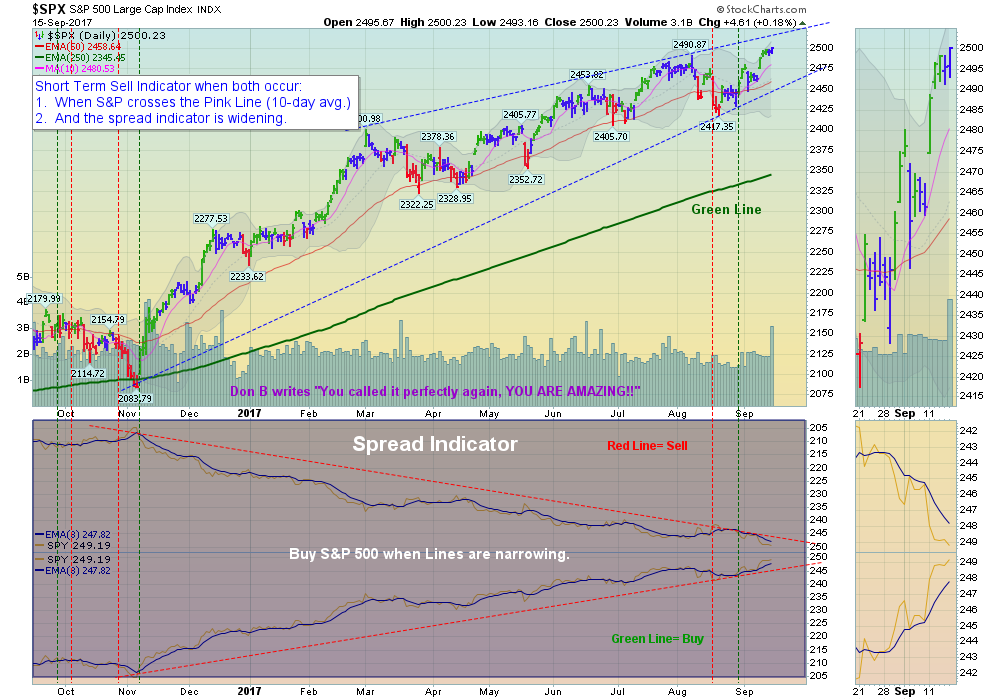
09/17/2017: Markets were up for the week, as the major Indices bounced up off their Red Lines (50-day avgs.) about 2 weeks ago. Many Indices were able to make New Highs. so Money is not leaving the Markets.
Most Funds are back up in the Red Zones, so Nimble traders should be raising Cash. This is a frustrating Market, as the Trump Rally has not corrected much since November, but is clearly weakening internally. Currently with Interest Rates so low, Stocks do not have any competition, but historically that will change.
The Money Wave Buy Signals are the Strongest, High Volume investments available (based on Relative Strength), The poor bounces of most Money Wave Buys recently indicates a very tired and over-bought Market. A quick Sep -Oct dump to the Green Lines would be better for Short Term Trades.
The weak US Dollar and low Interest Rates could indicate that the HOPE in Stocks is emotionally over-done, and a slowing Economy.
Crude Oil was up 5.1% for the week, and GOLD was down $26.00.
___________________________________________________________________________________________
MONEY WAVE BUYS SOON: We are currently in 1 logged Open Positions, and there are 5 Investments on the Short Term Watch List.
______________________________________________________________________________________________
LONG TERM TRADES
The Funds below are currently out of favor, but historically these could possibly Double or more from these lower levels. We are looking for a good Entry Point for these, but need the entire Economy & Inflation to pick up speed:
BITA BITA HOLDINGS Wait for Green Zone on the Weekly Chart.
DBC COMMODITY FUND Waiting for Break Out Above $16.08.
JJC COPPER FUND Back in Red Zone, but Relative Strength finally got up to 90.
KOL COAL FUND Wait for Green Zone on Daily Chart.
LL LUMBER LIQUIDATORS Wait for Green Zone on Daily Chart.
REMX RARE EARTH FUND Wait for Green Zone on Daily Chart.
UGA US GASOLINE FUND Waiting on Break Out Above $32.03.
VALE VALE DE RIO Break Out Above $11.39 on High Volume.
___________________________________________________________________________________________
Click for Portfolio (Open Positions)
Click for Watch List
Click for Closed Positions
Alert! Market Risk is Medium (Red Zone). The probability of successful Short Term Trades is lower, when the S&P 500 is Way Above the Green Line. Even the Strongest Funds can get chopped up. Either take quick gains from Money Wave Pops, or STAY IN CASH & WAIT for a larger correction.
[s_static_display]
Tell your Friends about the Green Line, and Help Animals.
4 Ways to Get your Daily Money Wave Alert:
- Emailed to your box between 3:30 3:50pm EDT.
- Website menu Commentary/Buy/Sell Signals
- Twitter notifications @AboveGreenLine
- Text messages: Email us your Cell number & phone carrier.


